| Red | Green | Blue | |
| z | 17.64 | ||
| znorm | Inf | ||
| sky | -Inf | -Inf | -Inf |
| S/N | 4.1 | 8.4 | 8.5 |
| S/N(c) | 0.0 | 0.0 | 0.0 |
| SN(E/C) |

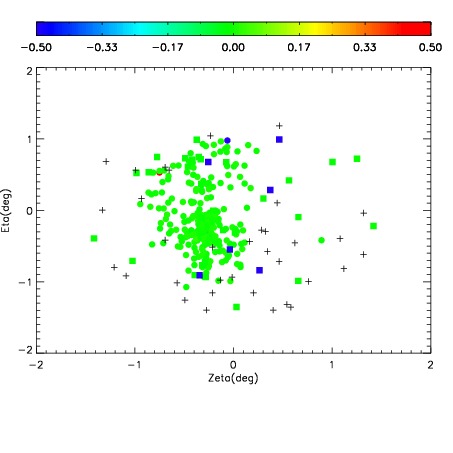
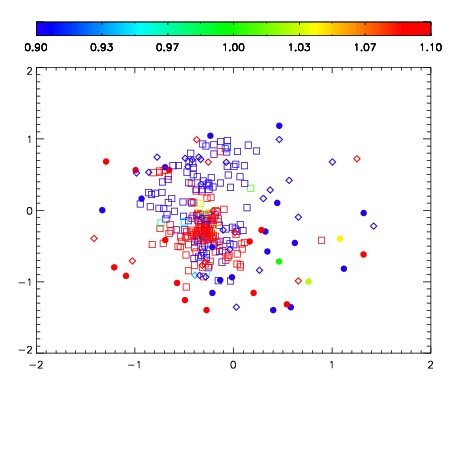


| Frame | Nreads | Zeropoints | Mag plots | Spatial mag deviation | Spatial sky 16325A emission deviations (filled: sky, open: star) | Spatial sky continuum emission | Spatial sky telluric CO2 absorption deviations (filled: H < 10) | |||||||||||||||||||||||
| 0 | 0 |
|
|
|
|
|
|
| IPAIR | NAME | SHIFT | NEWSHIFT | S/N | NAME | SHIFT | NEWSHIFT | S/N |
| 0 | 10680026 | 0.507468 | 0.00000 | 71.8177 | 10680024 | 0.00000 | 0.507468 | 106.627 |
| 1 | 10680030 | 0.507378 | 9.00030e-05 | 57.9377 | 10680027 | -0.000578437 | 0.508046 | 76.3746 |
| 2 | 10680025 | 0.506022 | 0.00144601 | 23.5697 | 10680028 | -0.000864293 | 0.508332 | 35.9682 |
| 3 | 10680029 | 0.506604 | 0.000863969 | 18.1656 | 10680031 | -0.00158340 | 0.509051 | 23.8534 |