| Red | Green | Blue | |
| z | 17.64 | ||
| znorm | Inf | ||
| sky | -Inf | -Inf | -Inf |
| S/N | 17.5 | 30.5 | 30.8 |
| S/N(c) | 0.0 | 0.0 | 0.0 |
| SN(E/C) |
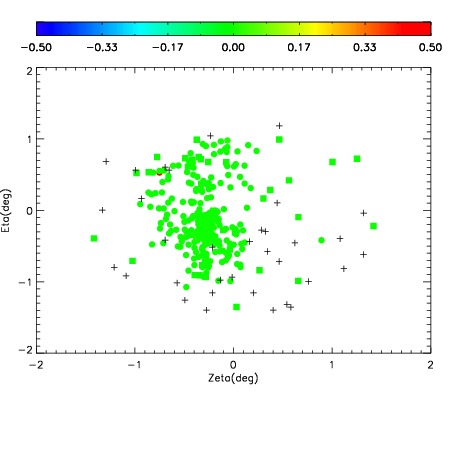
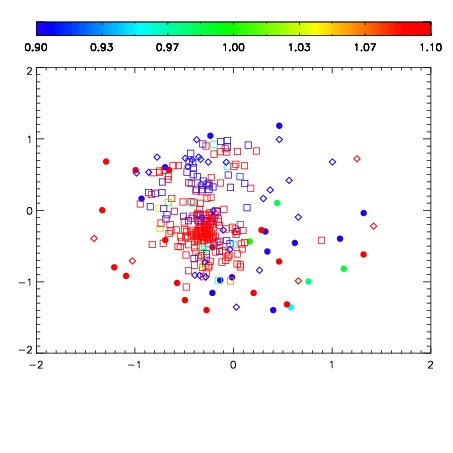
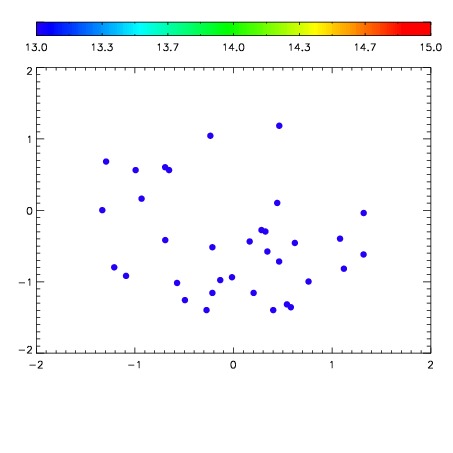

| Frame | Nreads | Zeropoints | Mag plots | Spatial mag deviation | Spatial sky 16325A emission deviations (filled: sky, open: star) | Spatial sky continuum emission | Spatial sky telluric CO2 absorption deviations (filled: H < 10) | |||||||||||||||||||||||
| 0 | 0 |
|
|
|
|
|
|
| IPAIR | NAME | SHIFT | NEWSHIFT | S/N | NAME | SHIFT | NEWSHIFT | S/N |
| 0 | 10730041 | 0.522169 | 0.00000 | 105.069 | 10730035 | 0.00000 | 0.522169 | 131.216 |
| 1 | 10730037 | 0.517804 | 0.00436497 | 167.607 | 10730039 | -0.00300231 | 0.525171 | 203.803 |
| 2 | 10730040 | 0.521216 | 0.000953019 | 158.602 | 10730038 | -0.00327405 | 0.525443 | 197.709 |
| 3 | 10730036 | 0.517771 | 0.00439799 | 104.413 | 10730042 | -0.000729986 | 0.522899 | 25.7854 |