| Red | Green | Blue | |
| z | 17.64 | ||
| znorm | Inf | ||
| sky | -Inf | -Inf | -Inf |
| S/N | 25.6 | 43.4 | 44.1 |
| S/N(c) | 0.0 | 0.0 | 0.0 |
| SN(E/C) |
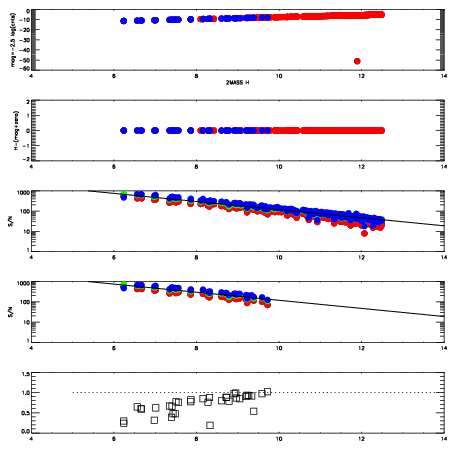
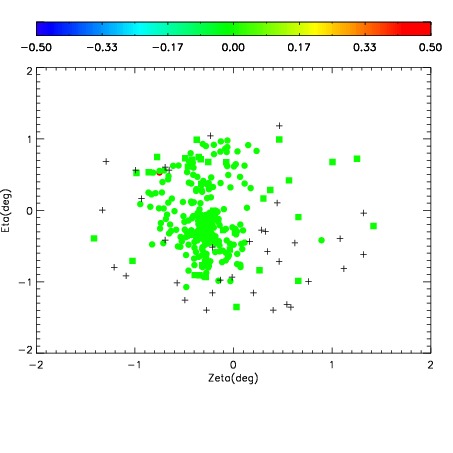
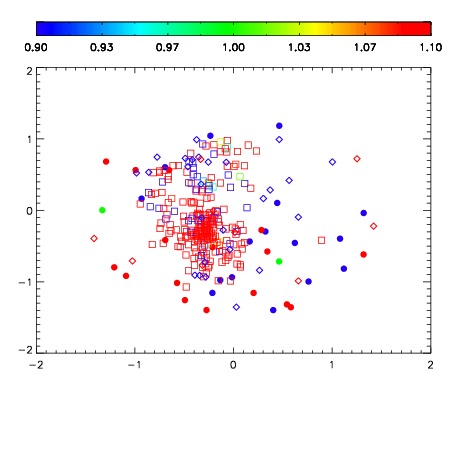
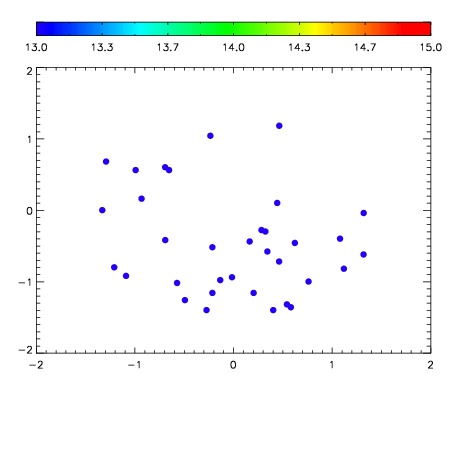

| Frame | Nreads | Zeropoints | Mag plots | Spatial mag deviation | Spatial sky 16325A emission deviations (filled: sky, open: star) | Spatial sky continuum emission | Spatial sky telluric CO2 absorption deviations (filled: H < 10) | |||||||||||||||||||||||
| 0 | 0 |
|
|
|
|
|
|
| IPAIR | NAME | SHIFT | NEWSHIFT | S/N | NAME | SHIFT | NEWSHIFT | S/N |
| 0 | 10740044 | 0.494492 | 0.00000 | 190.405 | 10740045 | -0.000183481 | 0.494675 | 182.843 |
| 1 | 10740048 | 0.493988 | 0.000503987 | 207.151 | 10740049 | -0.000855106 | 0.495347 | 209.173 |
| 2 | 10740047 | 0.493052 | 0.00143999 | 207.146 | 10740046 | -0.000633979 | 0.495126 | 193.094 |
| 3 | 10740043 | 0.494248 | 0.000243992 | 193.742 | 10740042 | 0.00000 | 0.494492 | 190.436 |