| Red | Green | Blue | |
| z | 17.64 | ||
| znorm | Inf | ||
| sky | -NaN | -NaN | -NaN |
| S/N | 23.9 | 40.7 | 39.7 |
| S/N(c) | 0.0 | 0.0 | 0.0 |
| SN(E/C) |
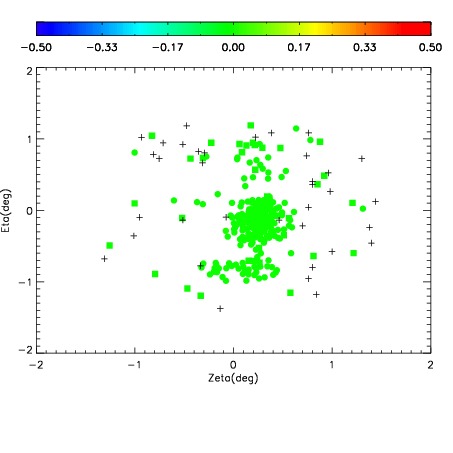
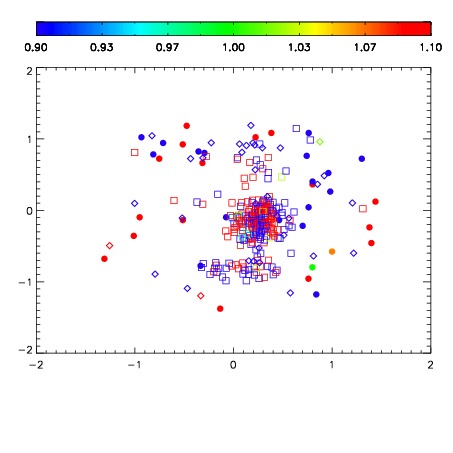
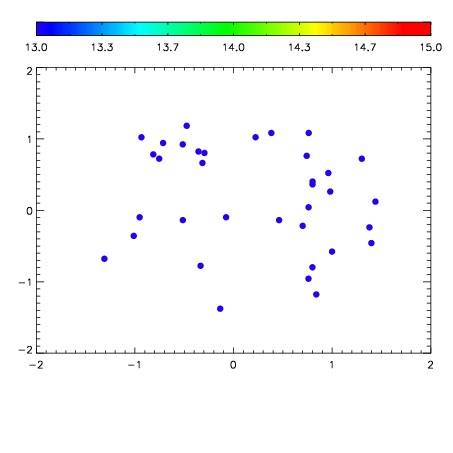

| Frame | Nreads | Zeropoints | Mag plots | Spatial mag deviation | Spatial sky 16325A emission deviations (filled: sky, open: star) | Spatial sky continuum emission | Spatial sky telluric CO2 absorption deviations (filled: H < 10) | |||||||||||||||||||||||
| 0 | 0 |
|
|
|
|
|
|
| IPAIR | NAME | SHIFT | NEWSHIFT | S/N | NAME | SHIFT | NEWSHIFT | S/N |
| 0 | 10940030 | 0.513109 | 0.00000 | 214.841 | 10940031 | 0.00165237 | 0.511457 | 208.360 |
| 1 | 10940026 | 0.511356 | 0.00175303 | 229.119 | 10940028 | -0.00274883 | 0.515858 | 232.772 |
| 2 | 10940029 | 0.512729 | 0.000380039 | 227.170 | 10940024 | 0.00000 | 0.513109 | 219.070 |
| 3 | 10940025 | 0.511304 | 0.00180501 | 219.389 | 10940027 | -0.00312829 | 0.516237 | 216.154 |