| Red | Green | Blue | |
| z | 17.64 | ||
| znorm | Inf | ||
| sky | -NaN | -Inf | -Inf |
| S/N | 30.4 | 49.2 | 51.1 |
| S/N(c) | 0.0 | 0.0 | 0.0 |
| SN(E/C) |
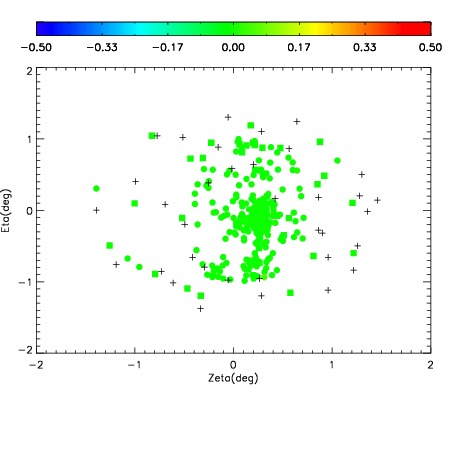
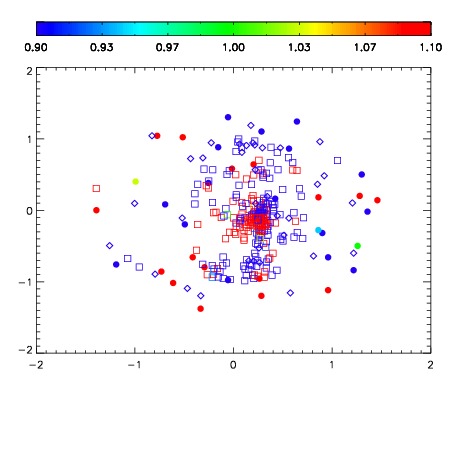
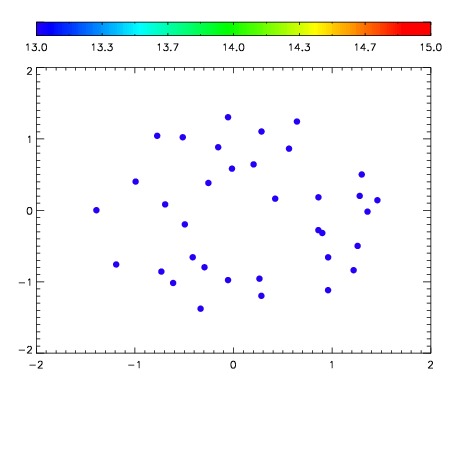

| Frame | Nreads | Zeropoints | Mag plots | Spatial mag deviation | Spatial sky 16325A emission deviations (filled: sky, open: star) | Spatial sky continuum emission | Spatial sky telluric CO2 absorption deviations (filled: H < 10) | |||||||||||||||||||||||
| 0 | 0 |
|
|
|
|
|
|
| IPAIR | NAME | SHIFT | NEWSHIFT | S/N | NAME | SHIFT | NEWSHIFT | S/N |
| 0 | 11040040 | 0.479706 | 0.00000 | 228.354 | 11040041 | -0.00357909 | 0.483285 | 228.766 |
| 1 | 11040044 | 0.479460 | 0.000245988 | 231.064 | 11040045 | -0.00229727 | 0.482003 | 234.243 |
| 2 | 11040039 | 0.479196 | 0.000509977 | 229.498 | 11040042 | -0.00428669 | 0.483993 | 229.426 |
| 3 | 11040043 | 0.478180 | 0.00152600 | 228.132 | 11040038 | 0.00000 | 0.479706 | 228.299 |