| Red | Green | Blue | |
| z | 17.64 | ||
| znorm | Inf | ||
| sky | -Inf | -Inf | -Inf |
| S/N | 21.9 | 37.5 | 40.0 |
| S/N(c) | 0.0 | 0.0 | 0.0 |
| SN(E/C) |
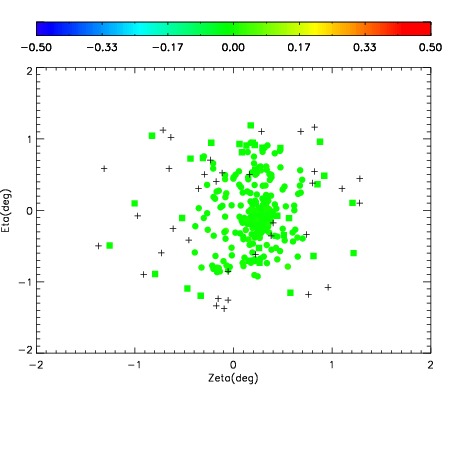
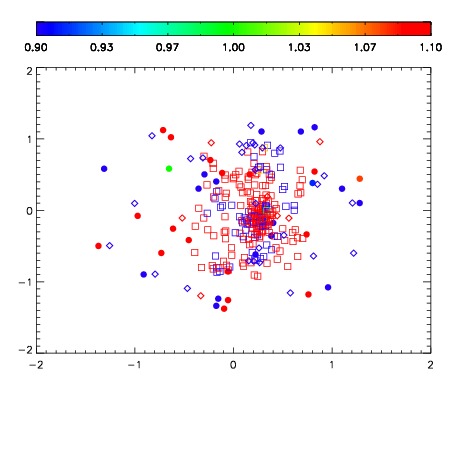
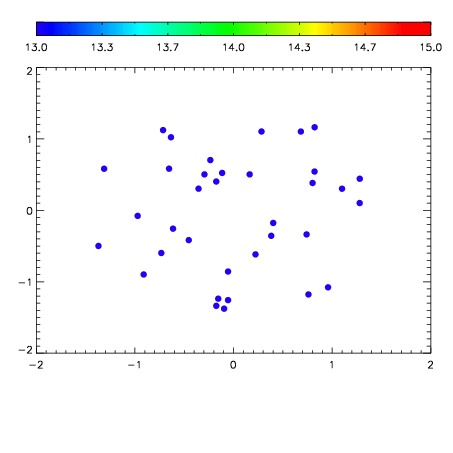

| Frame | Nreads | Zeropoints | Mag plots | Spatial mag deviation | Spatial sky 16325A emission deviations (filled: sky, open: star) | Spatial sky continuum emission | Spatial sky telluric CO2 absorption deviations (filled: H < 10) | |||||||||||||||||||||||
| 0 | 0 |
|
|
|
|
|
|
| IPAIR | NAME | SHIFT | NEWSHIFT | S/N | NAME | SHIFT | NEWSHIFT | S/N |
| 0 | 11080043 | 0.477785 | 0.00000 | 204.916 | 11080044 | -0.000416616 | 0.478202 | 214.606 |
| 1 | 11080042 | 0.477238 | 0.000546992 | 200.856 | 11080041 | -0.00112567 | 0.478911 | 206.758 |
| 2 | 11080039 | 0.477238 | 0.000546992 | 187.226 | 11080040 | -0.000914617 | 0.478700 | 194.184 |
| 3 | 11080038 | 0.476540 | 0.00124499 | 176.911 | 11080037 | 0.00000 | 0.477785 | 159.719 |