| Red | Green | Blue | |
| z | 17.64 | ||
| znorm | Inf | ||
| sky | -NaN | -NaN | -Inf |
| S/N | 29.2 | 46.5 | 48.3 |
| S/N(c) | 0.0 | 0.0 | 0.0 |
| SN(E/C) |
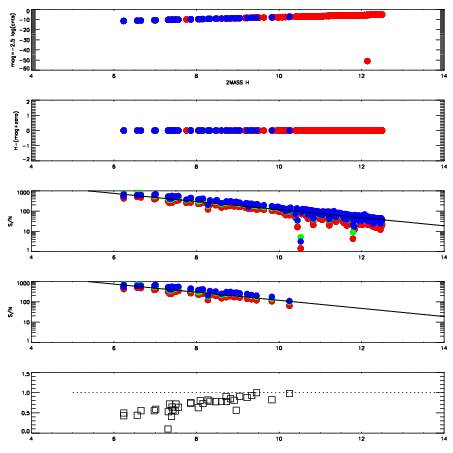
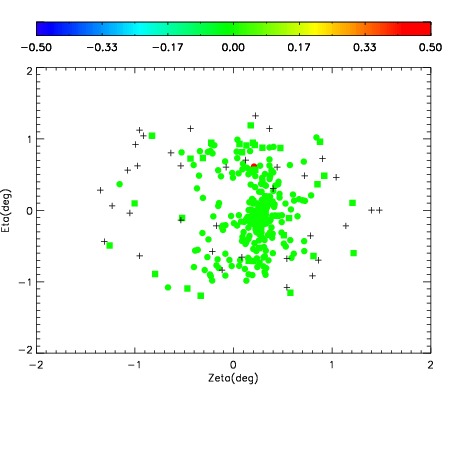
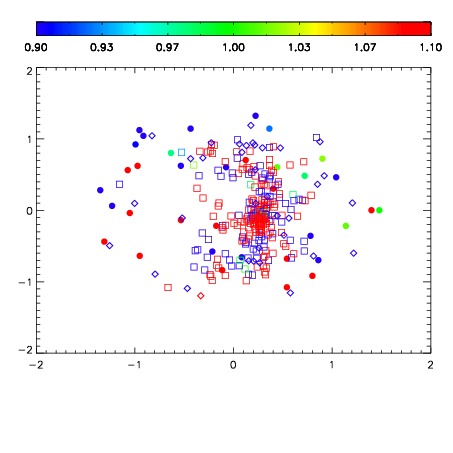
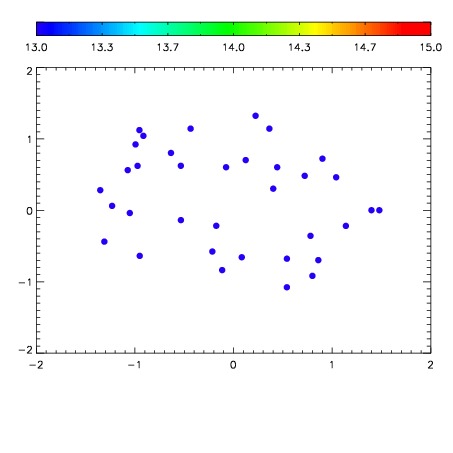

| Frame | Nreads | Zeropoints | Mag plots | Spatial mag deviation | Spatial sky 16325A emission deviations (filled: sky, open: star) | Spatial sky continuum emission | Spatial sky telluric CO2 absorption deviations (filled: H < 10) | |||||||||||||||||||||||
| 0 | 0 |
|
|
|
|
|
|
| IPAIR | NAME | SHIFT | NEWSHIFT | S/N | NAME | SHIFT | NEWSHIFT | S/N |
| 0 | 11090040 | 0.482606 | 0.00000 | 230.921 | 11090042 | -0.000334750 | 0.482941 | 228.556 |
| 1 | 11090043 | 0.480591 | 0.00201499 | 235.276 | 11090045 | 0.000683614 | 0.481922 | 233.593 |
| 2 | 11090044 | 0.481334 | 0.00127199 | 231.927 | 11090041 | -0.000361276 | 0.482967 | 231.547 |
| 3 | 11090039 | 0.481221 | 0.00138500 | 227.094 | 11090038 | 0.00000 | 0.482606 | 225.319 |