| Red | Green | Blue | |
| z | 17.64 | ||
| znorm | Inf | ||
| sky | -NaN | -Inf | -Inf |
| S/N | 24.1 | 40.5 | 41.2 |
| S/N(c) | 0.0 | 0.0 | 0.0 |
| SN(E/C) |
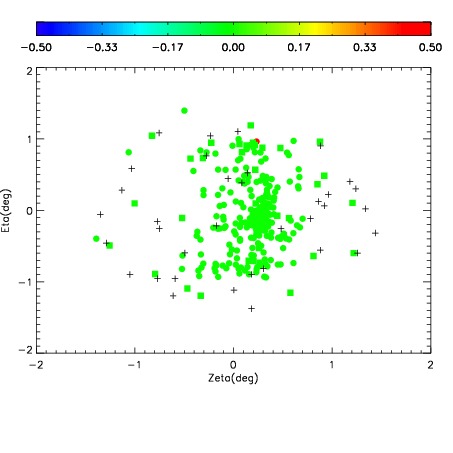
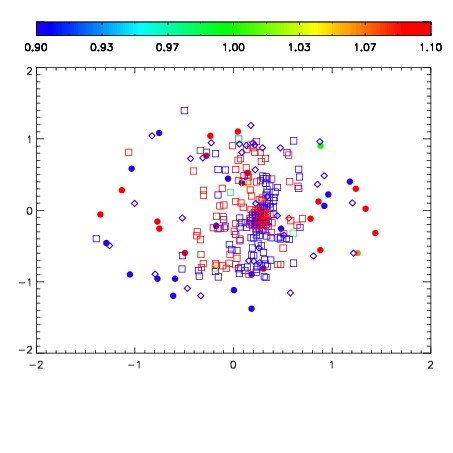
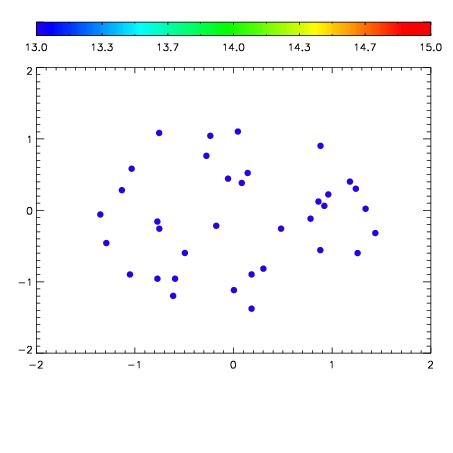

| Frame | Nreads | Zeropoints | Mag plots | Spatial mag deviation | Spatial sky 16325A emission deviations (filled: sky, open: star) | Spatial sky continuum emission | Spatial sky telluric CO2 absorption deviations (filled: H < 10) | |||||||||||||||||||||||
| 0 | 0 |
|
|
|
|
|
|
| IPAIR | NAME | SHIFT | NEWSHIFT | S/N | NAME | SHIFT | NEWSHIFT | S/N |
| 0 | 11100039 | 0.471816 | 0.00000 | 196.703 | 11100037 | 0.00000 | 0.471816 | 191.446 |
| 1 | 11100043 | 0.470476 | 0.00134000 | 205.100 | 11100044 | -0.00455996 | 0.476376 | 212.809 |
| 2 | 11100042 | 0.469483 | 0.00233302 | 202.704 | 11100041 | -0.000544307 | 0.472360 | 196.622 |
| 3 | 11100038 | 0.470907 | 0.000909001 | 196.598 | 11100040 | 9.44522e-05 | 0.471722 | 173.894 |