| Red | Green | Blue | |
| z | 17.64 | ||
| znorm | Inf | ||
| sky | -Inf | -Inf | -Inf |
| S/N | 18.0 | 30.8 | 30.7 |
| S/N(c) | 0.0 | 0.0 | 0.0 |
| SN(E/C) |
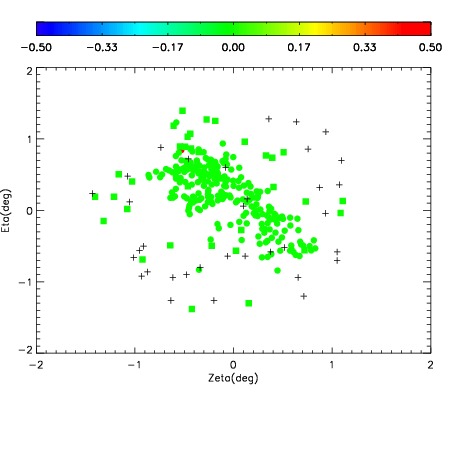
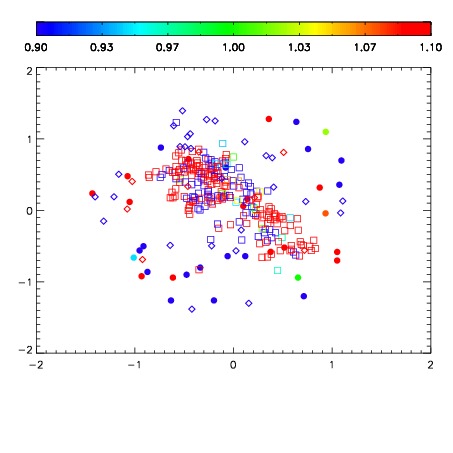
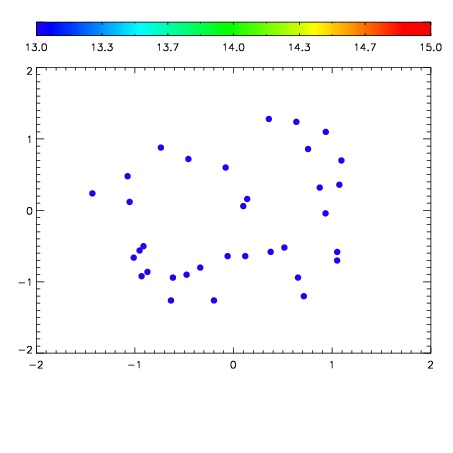

| Frame | Nreads | Zeropoints | Mag plots | Spatial mag deviation | Spatial sky 16325A emission deviations (filled: sky, open: star) | Spatial sky continuum emission | Spatial sky telluric CO2 absorption deviations (filled: H < 10) | |||||||||||||||||||||||
| 0 | 0 |
|
|
|
|
|
|
| IPAIR | NAME | SHIFT | NEWSHIFT | S/N | NAME | SHIFT | NEWSHIFT | S/N |
| 0 | 10900017 | 0.746871 | 0.00000 | 186.765 | 10900012 | 0.507384 | 0.239487 | 187.616 |
| 1 | 10900013 | 0.507819 | 0.239052 | 190.351 | 10900018 | 0.253648 | 0.493223 | 188.721 |
| 2 | 10900014 | 0.232973 | 0.513898 | 182.923 | 10900011 | 0.00000 | 0.746871 | 185.652 |
| 3 | 10900016 | 0.745806 | 0.00106502 | 180.144 | 10900015 | 0.233642 | 0.513229 | 173.989 |