| Red | Green | Blue | |
| z | 17.64 | ||
| znorm | Inf | ||
| sky | -NaN | -Inf | -Inf |
| S/N | 23.0 | 39.2 | 40.0 |
| S/N(c) | 0.0 | 0.0 | 0.0 |
| SN(E/C) |

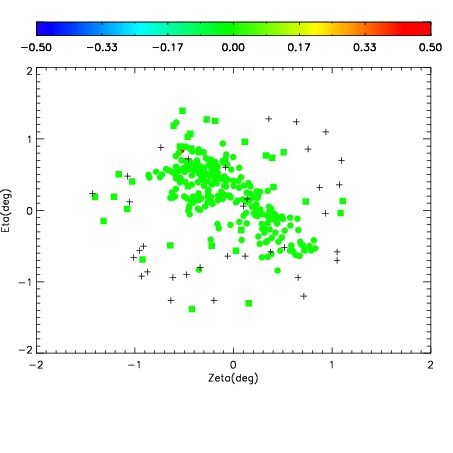
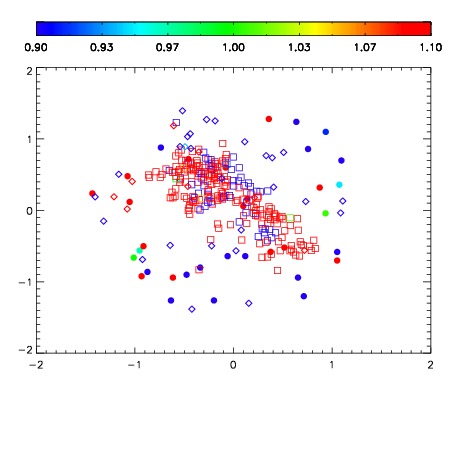
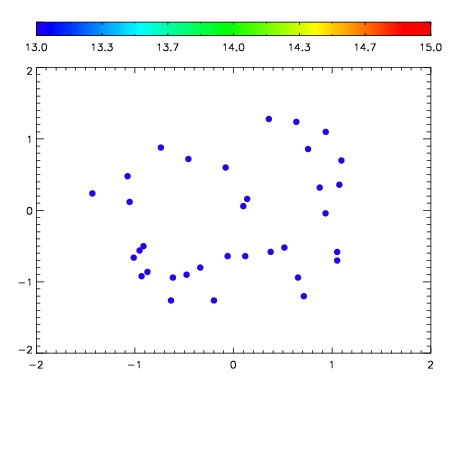

| Frame | Nreads | Zeropoints | Mag plots | Spatial mag deviation | Spatial sky 16325A emission deviations (filled: sky, open: star) | Spatial sky continuum emission | Spatial sky telluric CO2 absorption deviations (filled: H < 10) | |||||||||||||||||||||||
| 0 | 0 |
|
|
|
|
|
|
| IPAIR | NAME | SHIFT | NEWSHIFT | S/N | NAME | SHIFT | NEWSHIFT | S/N |
| 0 | 10910037 | 0.511234 | 0.00000 | 197.989 | 10910042 | -0.000193815 | 0.511428 | 195.525 |
| 1 | 10910036 | 0.510923 | 0.000310957 | 205.710 | 10910035 | 0.00000 | 0.511234 | 207.319 |
| 2 | 10910041 | 0.510442 | 0.000791967 | 192.671 | 10910039 | -0.00184756 | 0.513082 | 194.786 |
| 3 | 10910040 | 0.509747 | 0.00148696 | 181.253 | 10910038 | -0.00177359 | 0.513008 | 194.472 |