| Red | Green | Blue | |
| z | 17.64 | ||
| znorm | Inf | ||
| sky | -Inf | -NaN | -Inf |
| S/N | 33.0 | 54.4 | 54.4 |
| S/N(c) | 0.0 | 0.0 | 0.0 |
| SN(E/C) |

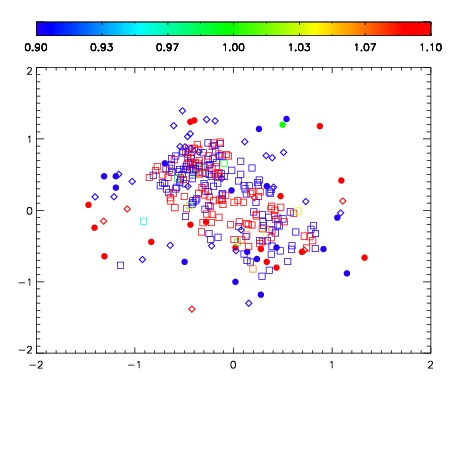
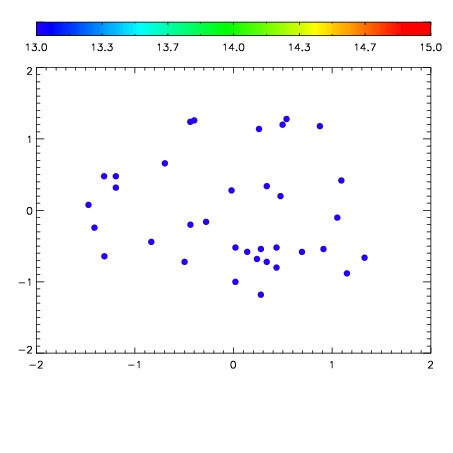

| Frame | Nreads | Zeropoints | Mag plots | Spatial mag deviation | Spatial sky 16325A emission deviations (filled: sky, open: star) | Spatial sky continuum emission | Spatial sky telluric CO2 absorption deviations (filled: H < 10) | |||||||||||||||||||||||
| 0 | 0 |
|
|
|
|
|
|
| IPAIR | NAME | SHIFT | NEWSHIFT | S/N | NAME | SHIFT | NEWSHIFT | S/N |
| 0 | 10920033 | 0.517391 | 0.00000 | 230.760 | 10920032 | -0.00160240 | 0.518993 | 220.027 |
| 1 | 10920030 | 0.514400 | 0.00299102 | 236.512 | 10920028 | -0.00297716 | 0.520368 | 240.150 |
| 2 | 10920029 | 0.513553 | 0.00383800 | 235.506 | 10920027 | -0.00302710 | 0.520418 | 236.096 |
| 3 | 10920026 | 0.516015 | 0.00137603 | 234.726 | 10920031 | -0.00259065 | 0.519982 | 232.523 |
| 4 | 10920025 | 0.516491 | 0.000900030 | 232.972 | 10920024 | 0.00000 | 0.517391 | 225.442 |