| Red | Green | Blue | |
| z | 17.64 | ||
| znorm | Inf | ||
| sky | -NaN | -Inf | -Inf |
| S/N | 23.2 | 38.5 | 40.9 |
| S/N(c) | 0.0 | 0.0 | 0.0 |
| SN(E/C) |
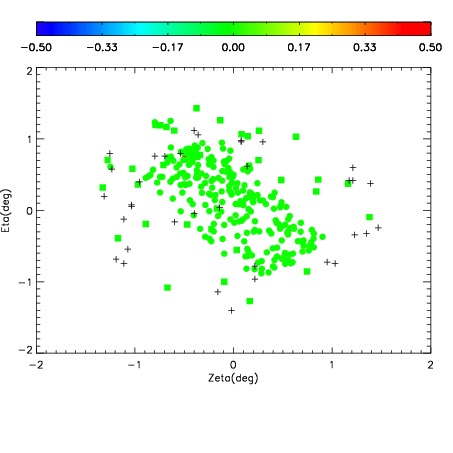
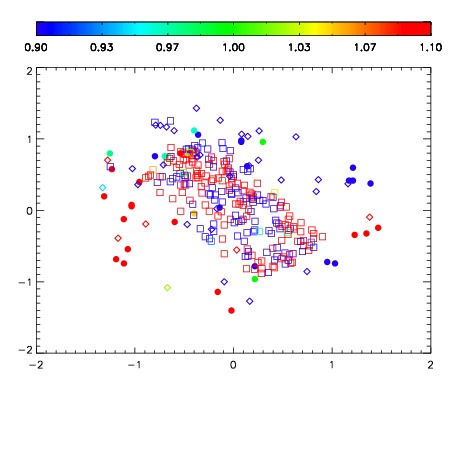


| Frame | Nreads | Zeropoints | Mag plots | Spatial mag deviation | Spatial sky 16325A emission deviations (filled: sky, open: star) | Spatial sky continuum emission | Spatial sky telluric CO2 absorption deviations (filled: H < 10) | |||||||||||||||||||||||
| 0 | 0 |
|
|
|
|
|
|
| IPAIR | NAME | SHIFT | NEWSHIFT | S/N | NAME | SHIFT | NEWSHIFT | S/N |
| 0 | 11060047 | 0.481037 | 0.00000 | 182.139 | 11060045 | -0.00232656 | 0.483364 | 188.060 |
| 1 | 11060046 | 0.479966 | 0.00107098 | 184.938 | 11060048 | -5.17706e-05 | 0.481089 | 189.340 |
| 2 | 11060043 | 0.480673 | 0.000364006 | 177.310 | 11060044 | -0.00284762 | 0.483885 | 181.936 |
| 3 | 11060042 | 0.480336 | 0.000700980 | 175.554 | 11060041 | 0.00000 | 0.481037 | 174.877 |