| Red | Green | Blue | |
| z | 17.64 | ||
| znorm | Inf | ||
| sky | -Inf | -NaN | -Inf |
| S/N | 27.4 | 45.6 | 48.0 |
| S/N(c) | 0.0 | 0.0 | 0.0 |
| SN(E/C) |
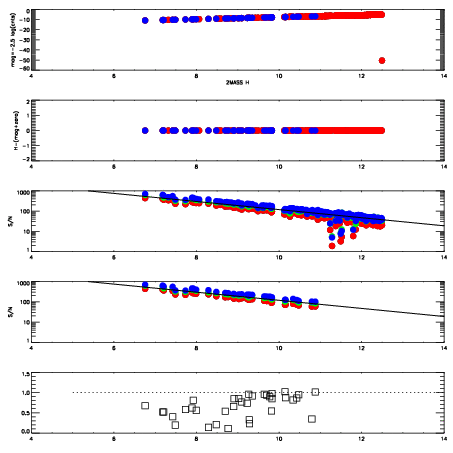
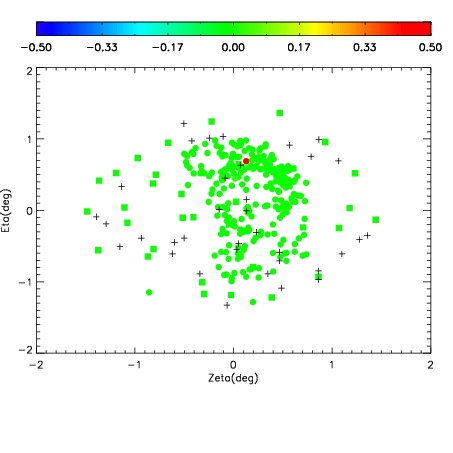
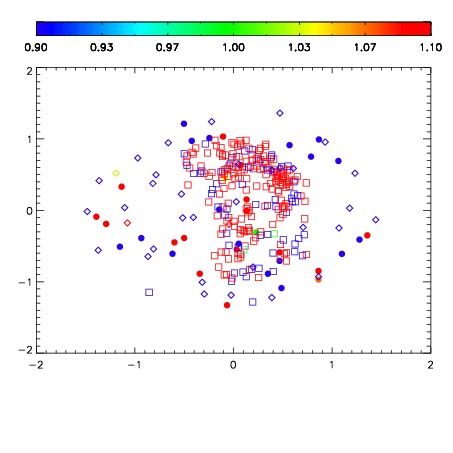
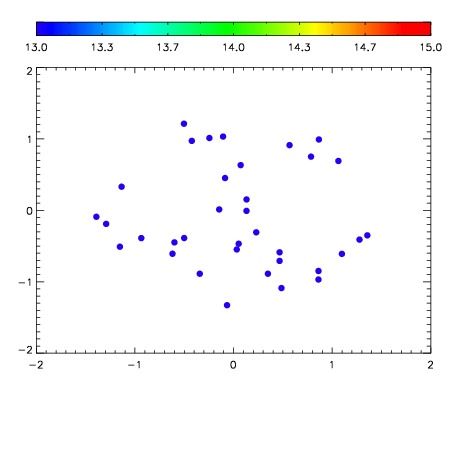

| Frame | Nreads | Zeropoints | Mag plots | Spatial mag deviation | Spatial sky 16325A emission deviations (filled: sky, open: star) | Spatial sky continuum emission | Spatial sky telluric CO2 absorption deviations (filled: H < 10) | |||||||||||||||||||||||
| 0 | 0 |
|
|
|
|
|
|
| IPAIR | NAME | SHIFT | NEWSHIFT | S/N | NAME | SHIFT | NEWSHIFT | S/N |
| 0 | 10250089 | 0.494461 | 0.00000 | 162.871 | 10250090 | 0.00173971 | 0.492721 | 166.762 |
| 1 | 10250088 | 0.493866 | 0.000595003 | 158.855 | 10250087 | 0.00193904 | 0.492522 | 151.849 |
| 2 | 10250085 | 0.492516 | 0.00194499 | 149.753 | 10250086 | 0.00187960 | 0.492581 | 150.604 |
| 3 | 10250084 | 0.492197 | 0.00226399 | 149.388 | 10250083 | 0.00000 | 0.494461 | 147.315 |