| Red | Green | Blue | |
| z | 17.64 | ||
| znorm | Inf | ||
| sky | -NaN | -NaN | -Inf |
| S/N | 23.8 | 40.0 | 44.2 |
| S/N(c) | 0.0 | 0.0 | 0.0 |
| SN(E/C) |
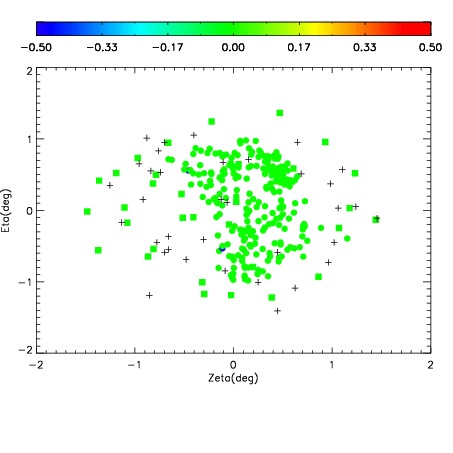
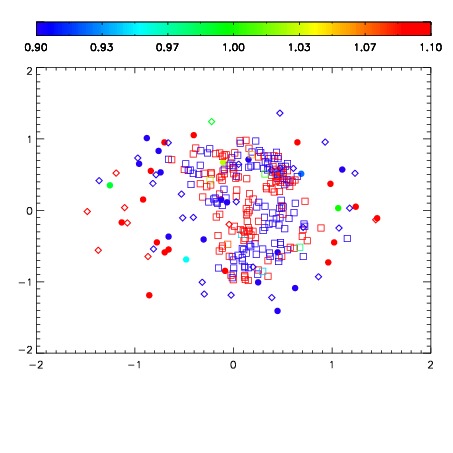
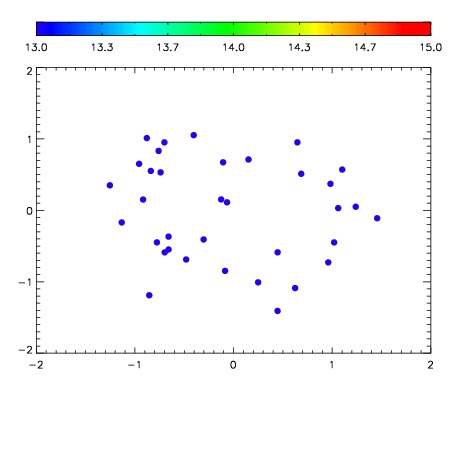

| Frame | Nreads | Zeropoints | Mag plots | Spatial mag deviation | Spatial sky 16325A emission deviations (filled: sky, open: star) | Spatial sky continuum emission | Spatial sky telluric CO2 absorption deviations (filled: H < 10) | |||||||||||||||||||||||
| 0 | 0 |
|
|
|
|
|
|
| IPAIR | NAME | SHIFT | NEWSHIFT | S/N | NAME | SHIFT | NEWSHIFT | S/N |
| 0 | 11120038 | 0.484015 | 0.00000 | 118.332 | 11120037 | 0.00000 | 0.484015 | 116.160 |
| 1 | 11120042 | 0.482860 | 0.00115499 | 119.458 | 11120044 | -0.00313042 | 0.487145 | 121.807 |
| 2 | 11120043 | 0.483141 | 0.000873983 | 118.772 | 11120041 | -0.00379335 | 0.487808 | 119.670 |
| 3 | 11120039 | 0.483791 | 0.000223994 | 111.113 | 11120040 | -0.00357136 | 0.487586 | 113.568 |