| Red | Green | Blue | |
| z | 17.64 | ||
| znorm | Inf | ||
| sky | -Inf | -Inf | -Inf |
| S/N | 35.7 | 54.1 | 60.2 |
| S/N(c) | 0.0 | 0.0 | 0.0 |
| SN(E/C) |
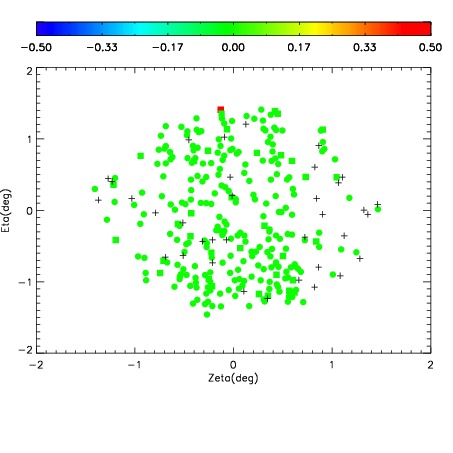
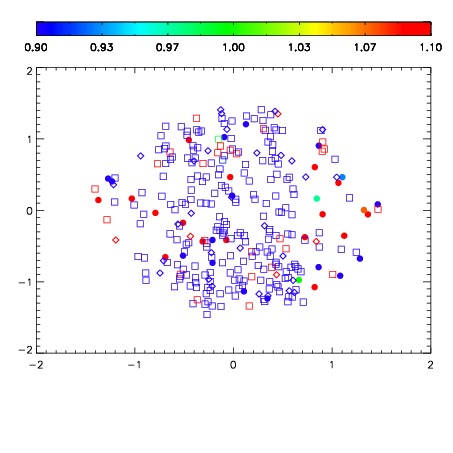
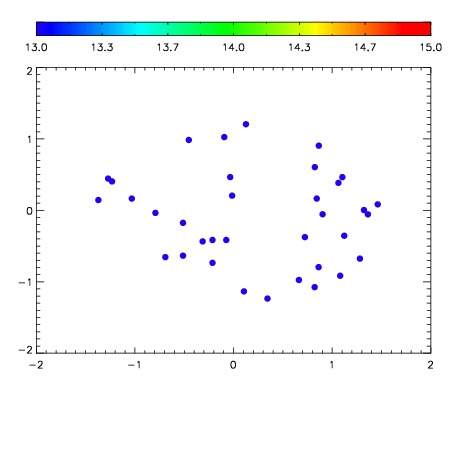

| Frame | Nreads | Zeropoints | Mag plots | Spatial mag deviation | Spatial sky 16325A emission deviations (filled: sky, open: star) | Spatial sky continuum emission | Spatial sky telluric CO2 absorption deviations (filled: H < 10) | |||||||||||||||||||||||
| 0 | 0 |
|
|
|
|
|
|
| IPAIR | NAME | SHIFT | NEWSHIFT | S/N | NAME | SHIFT | NEWSHIFT | S/N |
| 0 | 10890065 | 0.501428 | 0.00000 | 190.202 | 10890066 | -0.000277668 | 0.501706 | 188.492 |
| 1 | 10890061 | 0.500337 | 0.00109100 | 195.464 | 10890059 | 0.00000 | 0.501428 | 194.939 |
| 2 | 10890060 | 0.499270 | 0.00215802 | 192.190 | 10890062 | -0.00353131 | 0.504959 | 192.028 |
| 3 | 10890064 | 0.501109 | 0.000319004 | 180.305 | 10890063 | -0.00317377 | 0.504602 | 185.706 |