| Red | Green | Blue | |
| z | 17.64 | ||
| znorm | Inf | ||
| sky | -Inf | -Inf | -Inf |
| S/N | 26.8 | 46.9 | 51.4 |
| S/N(c) | 0.0 | 0.0 | 0.0 |
| SN(E/C) |

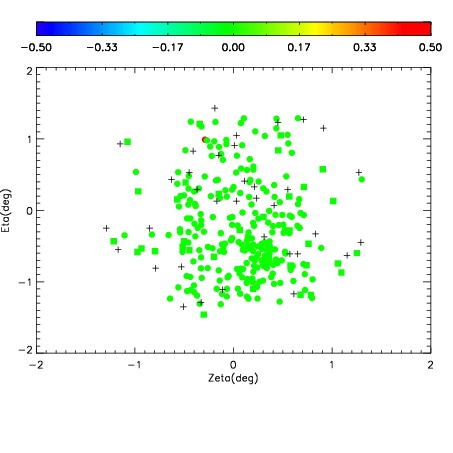
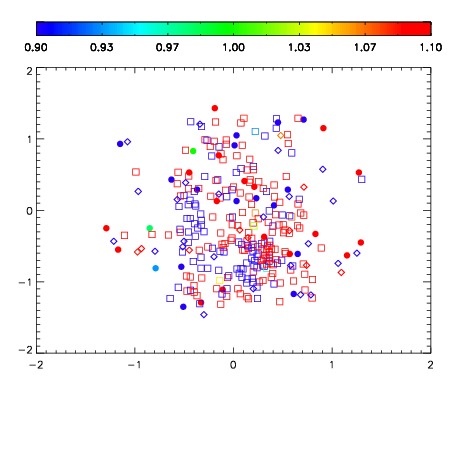
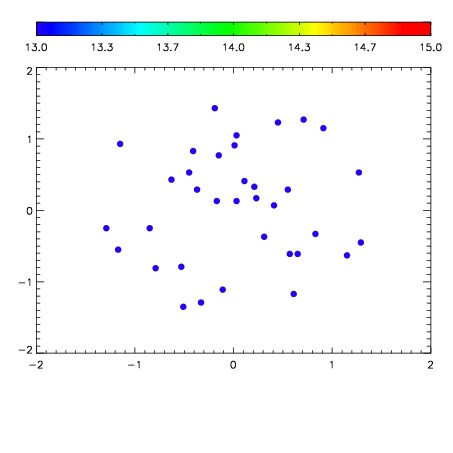

| Frame | Nreads | Zeropoints | Mag plots | Spatial mag deviation | Spatial sky 16325A emission deviations (filled: sky, open: star) | Spatial sky continuum emission | Spatial sky telluric CO2 absorption deviations (filled: H < 10) | |||||||||||||||||||||||
| 0 | 0 |
|
|
|
|
|
|
| IPAIR | NAME | SHIFT | NEWSHIFT | S/N | NAME | SHIFT | NEWSHIFT | S/N |
| 0 | 11070043 | 0.482745 | 0.00000 | 250.146 | 11070044 | -0.00140606 | 0.484151 | 255.215 |
| 1 | 11070042 | 0.481724 | 0.00102100 | 249.348 | 11070037 | 0.00000 | 0.482745 | 236.596 |
| 2 | 11070039 | 0.481372 | 0.00137299 | 242.412 | 11070040 | -0.00192958 | 0.484675 | 232.722 |
| 3 | 11070038 | 0.480314 | 0.00243101 | 227.596 | 11070041 | -0.000519788 | 0.483265 | 218.392 |