| Red | Green | Blue | |
| z | 17.64 | ||
| znorm | Inf | ||
| sky | -Inf | -NaN | -Inf |
| S/N | 25.1 | 43.6 | 47.4 |
| S/N(c) | 0.0 | 0.0 | 0.0 |
| SN(E/C) |
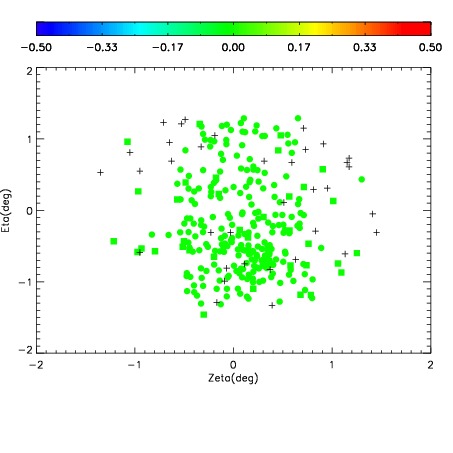

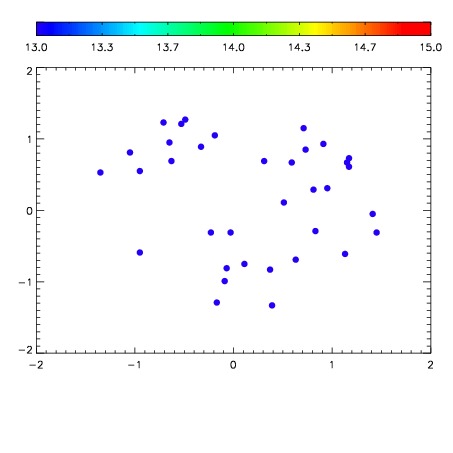

| Frame | Nreads | Zeropoints | Mag plots | Spatial mag deviation | Spatial sky 16325A emission deviations (filled: sky, open: star) | Spatial sky continuum emission | Spatial sky telluric CO2 absorption deviations (filled: H < 10) | |||||||||||||||||||||||
| 0 | 0 |
|
|
|
|
|
|
| IPAIR | NAME | SHIFT | NEWSHIFT | S/N | NAME | SHIFT | NEWSHIFT | S/N |
| 0 | 11090051 | 0.479642 | 0.00000 | 210.599 | 11090052 | 0.00113570 | 0.478506 | 198.327 |
| 1 | 11090055 | 0.478337 | 0.00130501 | 220.488 | 11090056 | 0.000289090 | 0.479353 | 220.175 |
| 2 | 11090054 | 0.478233 | 0.00140899 | 217.667 | 11090053 | 0.00127745 | 0.478365 | 213.905 |
| 3 | 11090050 | 0.478799 | 0.000843018 | 213.341 | 11090049 | 0.00000 | 0.479642 | 208.334 |