| Red | Green | Blue | |
| z | 17.64 | ||
| znorm | Inf | ||
| sky | -Inf | -Inf | -Inf |
| S/N | 20.0 | 36.7 | 40.4 |
| S/N(c) | 0.0 | 0.0 | 0.0 |
| SN(E/C) |

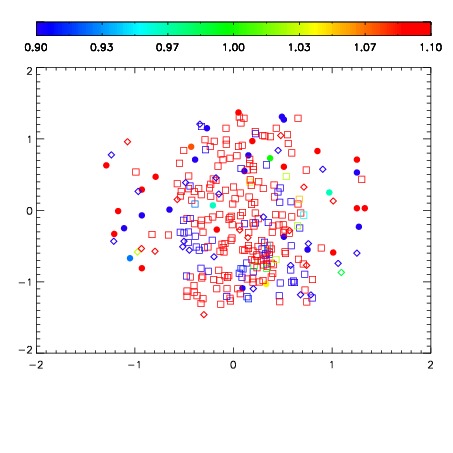
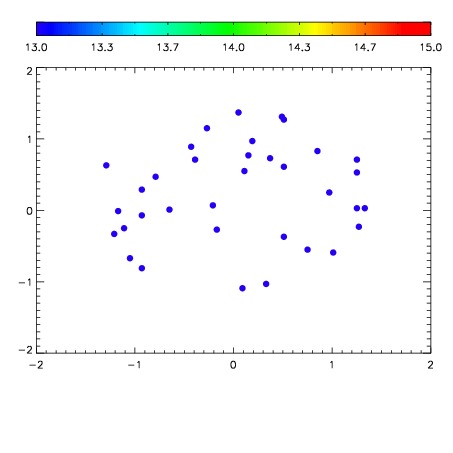

| Frame | Nreads | Zeropoints | Mag plots | Spatial mag deviation | Spatial sky 16325A emission deviations (filled: sky, open: star) | Spatial sky continuum emission | Spatial sky telluric CO2 absorption deviations (filled: H < 10) | |||||||||||||||||||||||
| 0 | 0 |
|
|
|
|
|
|
| IPAIR | NAME | SHIFT | NEWSHIFT | S/N | NAME | SHIFT | NEWSHIFT | S/N |
| 0 | 10900028 | 0.603768 | 0.00000 | 180.953 | 10900022 | 0.00000 | 0.603768 | 193.195 |
| 1 | 10900024 | 0.527388 | 0.0763800 | 195.271 | 10900026 | 0.0832575 | 0.520510 | 200.539 |
| 2 | 10900023 | 0.527048 | 0.0767200 | 194.203 | 10900025 | 0.0827273 | 0.521041 | 195.086 |
| 3 | 10900027 | 0.603642 | 0.000126004 | 173.761 | 10900029 | 0.0831598 | 0.520608 | 188.967 |