| Red | Green | Blue | |
| z | 17.64 | ||
| znorm | Inf | ||
| sky | -Inf | -NaN | -Inf |
| S/N | 35.2 | 54.7 | 61.4 |
| S/N(c) | 35.2 | 54.7 | 61.4 |
| SN(E/C) |
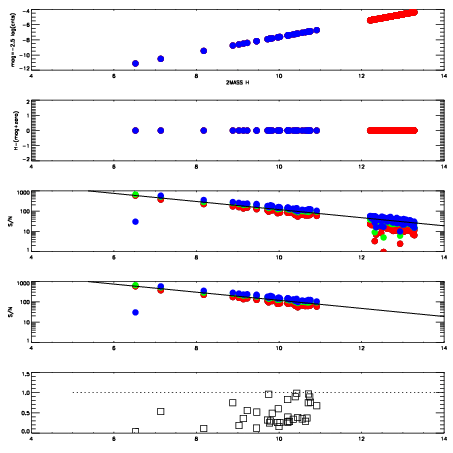

| Frame | Nreads | Zeropoints | Mag plots | Spatial mag deviation | Spatial sky 16325A emission deviations (filled: sky, open: star) | Spatial sky continuum emission | Spatial sky telluric CO2 absorption deviations (filled: H < 10) | |||||||||||||||||||||||
| 0 | 0 |
|
|
|
|
|
|
| IPAIR | NAME | SHIFT | NEWSHIFT | S/N | NAME | SHIFT | NEWSHIFT | S/N |
| 0 | 10920060 | 0.511863 | 0.00000 | 143.208 | 10920066 | -0.00345415 | 0.515317 | 140.072 |
| 1 | 10920065 | 0.511634 | 0.000229001 | 143.919 | 10920059 | 0.00000 | 0.511863 | 148.376 |
| 2 | 10920064 | 0.511167 | 0.000696003 | 141.752 | 10920062 | -0.00160796 | 0.513471 | 139.799 |
| 3 | 10920061 | 0.511590 | 0.000272989 | 136.826 | 10920063 | -0.00151094 | 0.513374 | 136.492 |