| Red | Green | Blue | |
| z | 17.64 | ||
| znorm | Inf | ||
| sky | -Inf | -Inf | -Inf |
| S/N | 33.1 | 53.2 | 59.5 |
| S/N(c) | 33.1 | 53.2 | 59.5 |
| SN(E/C) |
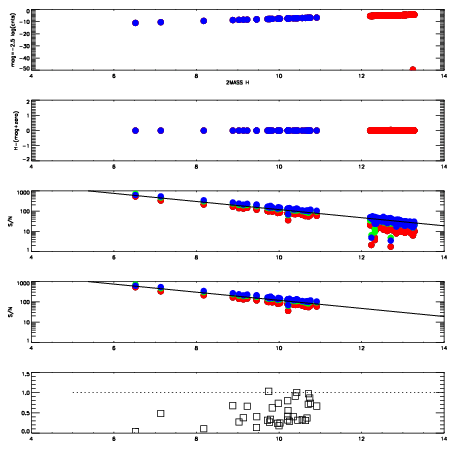
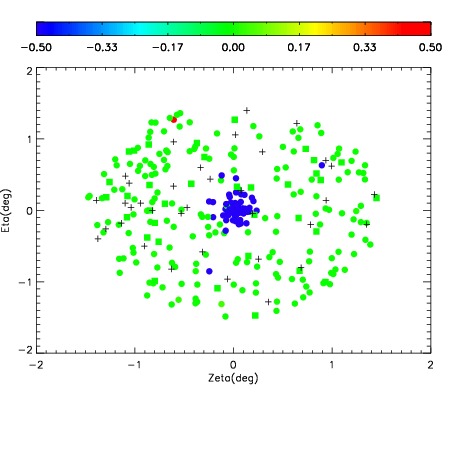

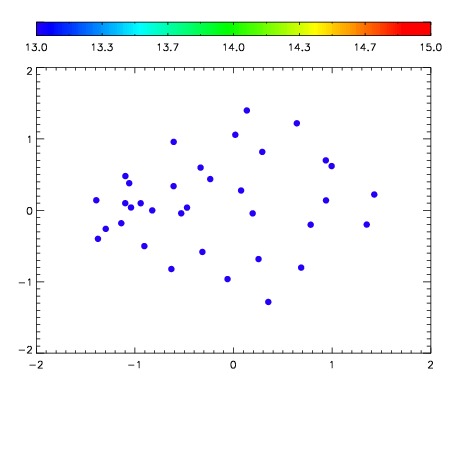

| Frame | Nreads | Zeropoints | Mag plots | Spatial mag deviation | Spatial sky 16325A emission deviations (filled: sky, open: star) | Spatial sky continuum emission | Spatial sky telluric CO2 absorption deviations (filled: H < 10) | |||||||||||||||||||||||
| 0 | 0 |
|
|
|
|
|
|
| IPAIR | NAME | SHIFT | NEWSHIFT | S/N | NAME | SHIFT | NEWSHIFT | S/N |
| 0 | 11060079 | 0.482772 | 0.00000 | 150.916 | 11060074 | 0.00000 | 0.482772 | 148.991 |
| 1 | 11060076 | 0.482604 | 0.000167996 | 155.065 | 11060078 | -0.00133503 | 0.484107 | 155.364 |
| 2 | 11060075 | 0.482351 | 0.000420988 | 153.372 | 11060077 | -0.00128754 | 0.484060 | 149.899 |
| 3 | 11060080 | 0.482292 | 0.000479996 | 146.737 | 11060081 | 0.00283253 | 0.479939 | 147.045 |