| Red | Green | Blue | |
| z | 17.64 | ||
| znorm | Inf | ||
| sky | -Inf | -Inf | -Inf |
| S/N | 21.2 | 35.6 | 39.0 |
| S/N(c) | 21.2 | 35.6 | 39.0 |
| SN(E/C) |

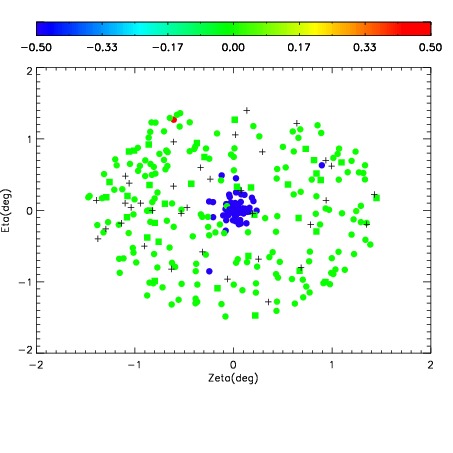
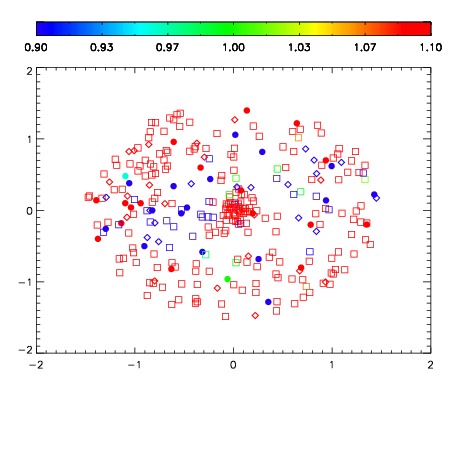
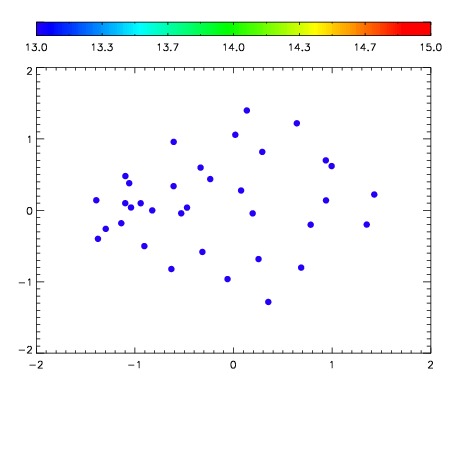

| Frame | Nreads | Zeropoints | Mag plots | Spatial mag deviation | Spatial sky 16325A emission deviations (filled: sky, open: star) | Spatial sky continuum emission | Spatial sky telluric CO2 absorption deviations (filled: H < 10) | |||||||||||||||||||||||
| 0 | 0 |
|
|
|
|
|
|
| IPAIR | NAME | SHIFT | NEWSHIFT | S/N | NAME | SHIFT | NEWSHIFT | S/N |
| 0 | 11360054 | 0.482643 | 0.00000 | 68.0824 | 11360051 | -0.000237962 | 0.482881 | 85.9608 |
| 1 | 11360049 | 0.481583 | 0.00106001 | 117.491 | 11360048 | 0.00000 | 0.482643 | 120.364 |
| 2 | 11360050 | 0.482205 | 0.000438005 | 111.747 | 11360055 | 0.000181296 | 0.482462 | 112.767 |
| 3 | 11360053 | 0.482164 | 0.000479013 | 104.769 | 11360052 | -0.000505671 | 0.483149 | 92.1060 |