| Red | Green | Blue | |
| z | 17.64 | ||
| znorm | Inf | ||
| sky | -NaN | -Inf | -Inf |
| S/N | 29.4 | 47.2 | 53.0 |
| S/N(c) | 29.4 | 47.2 | 53.0 |
| SN(E/C) |
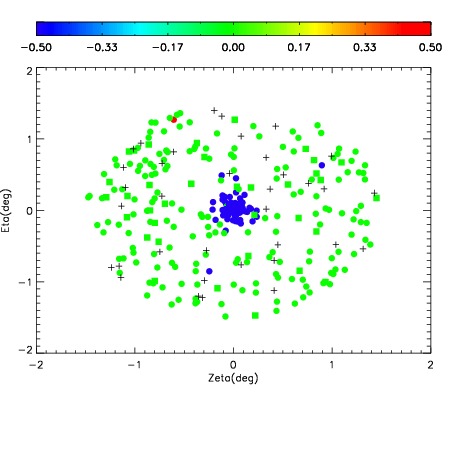
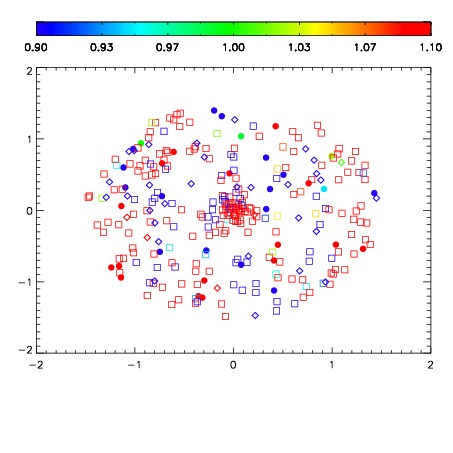
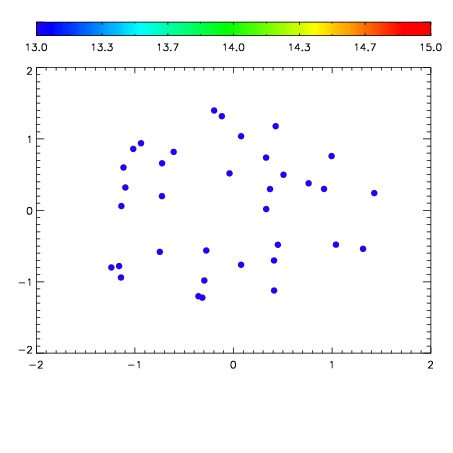

| Frame | Nreads | Zeropoints | Mag plots | Spatial mag deviation | Spatial sky 16325A emission deviations (filled: sky, open: star) | Spatial sky continuum emission | Spatial sky telluric CO2 absorption deviations (filled: H < 10) | |||||||||||||||||||||||
| 0 | 0 |
|
|
|
|
|
|
| IPAIR | NAME | SHIFT | NEWSHIFT | S/N | NAME | SHIFT | NEWSHIFT | S/N |
| 0 | 11100076 | 0.474842 | 0.00000 | 125.056 | 11100074 | -0.00475485 | 0.479597 | 131.786 |
| 1 | 11100072 | 0.472999 | 0.00184301 | 131.921 | 11100073 | -0.00501381 | 0.479856 | 134.797 |
| 2 | 11100075 | 0.473834 | 0.00100800 | 119.771 | 11100077 | -0.00449248 | 0.479335 | 128.559 |
| 3 | 11100071 | 0.473053 | 0.00178900 | 108.093 | 11100070 | 0.00000 | 0.474842 | 113.315 |