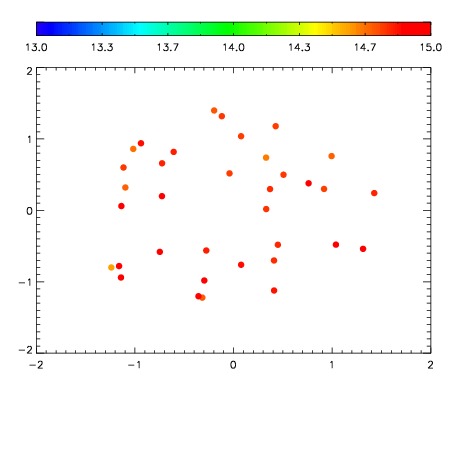
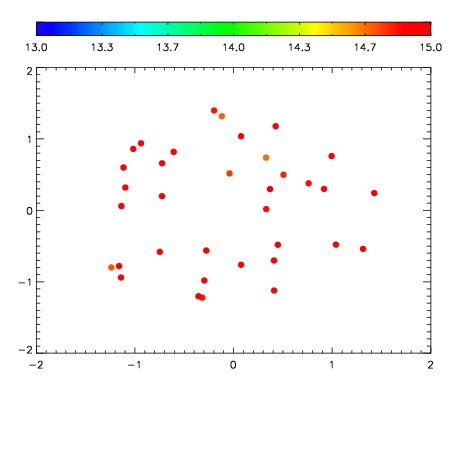
| Frame | Nreads | Zeropoints | Mag plots
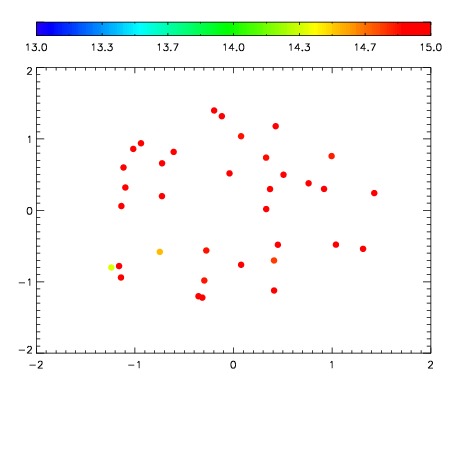
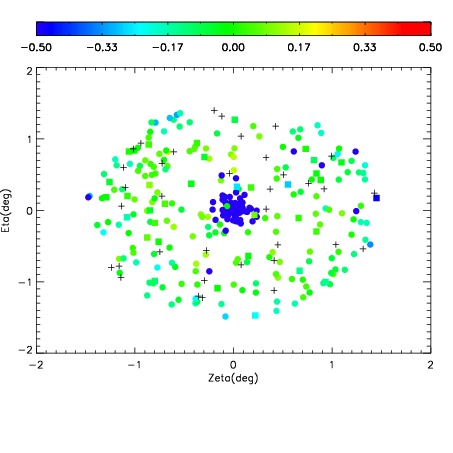
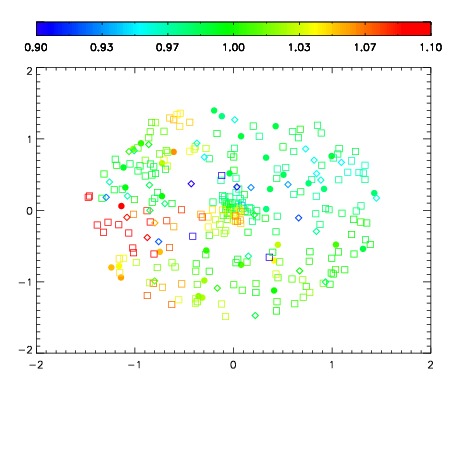
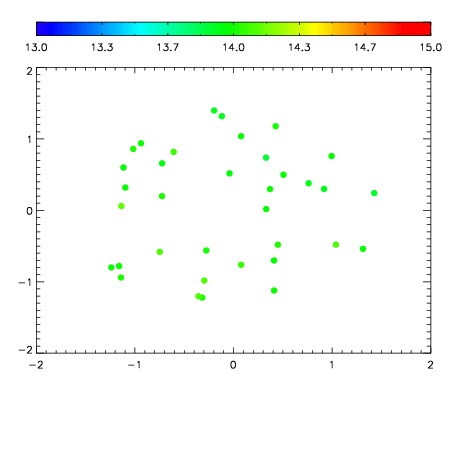
| Spatial mag deviation
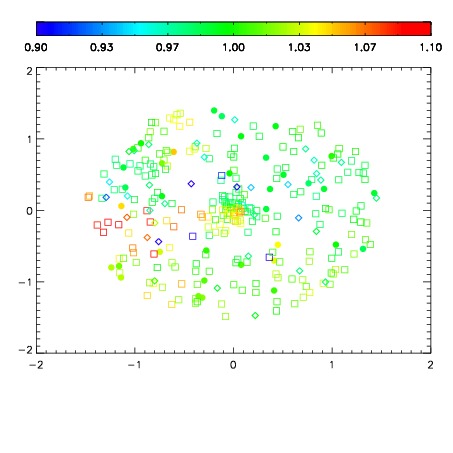
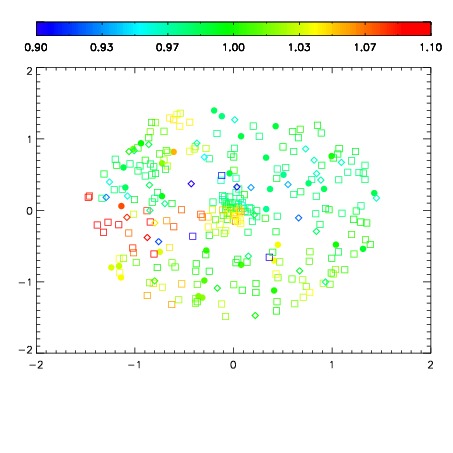
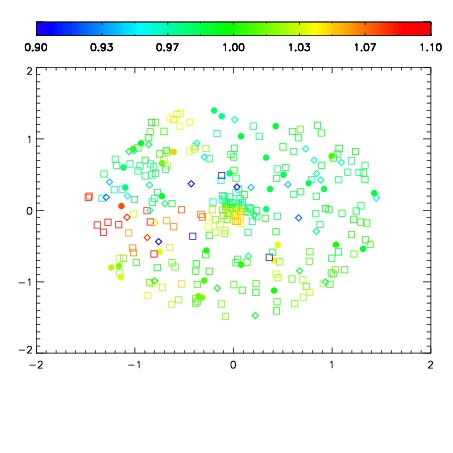
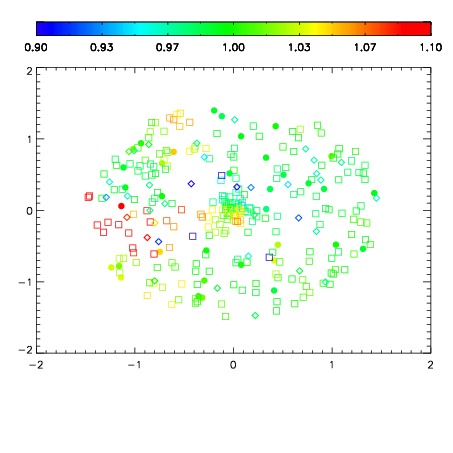
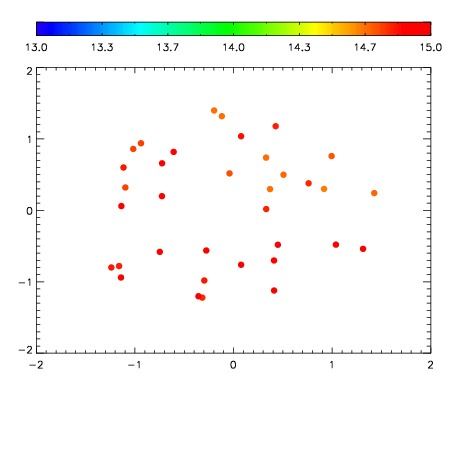
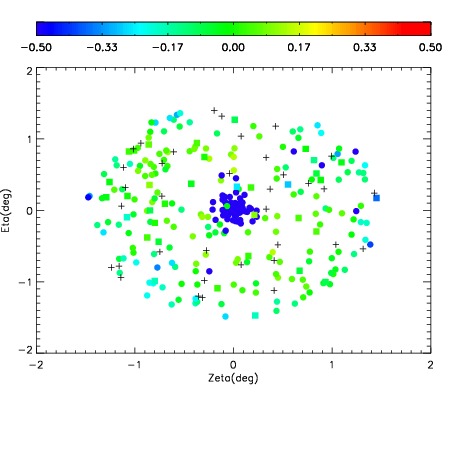
| Spatial sky 16325A emission deviations (filled: sky, open: star)
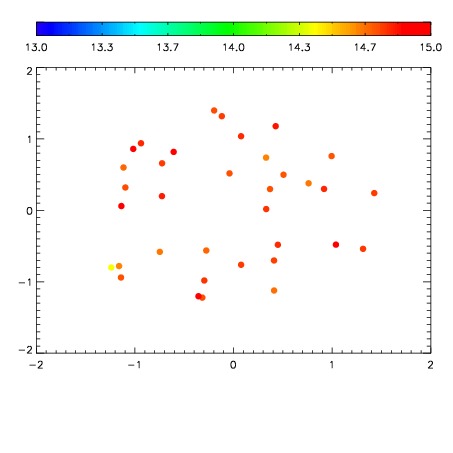
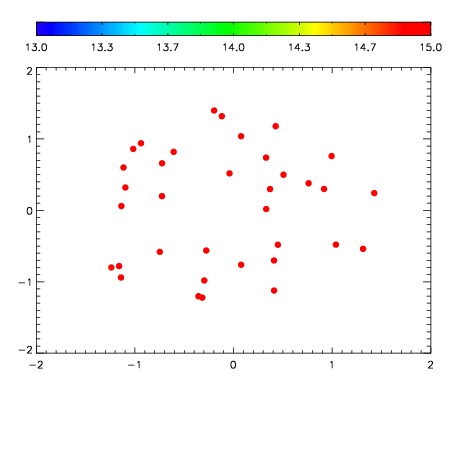
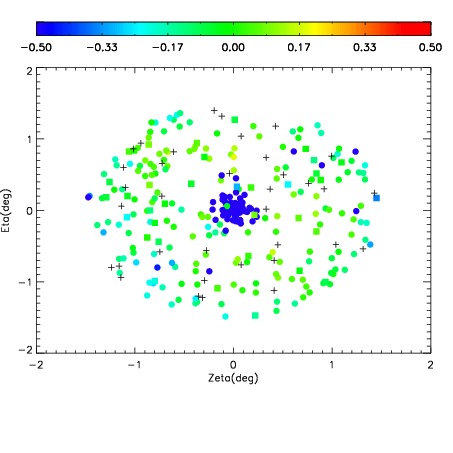
| Spatial sky continuum emission
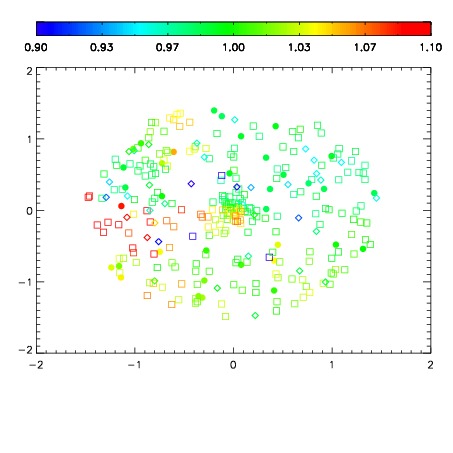
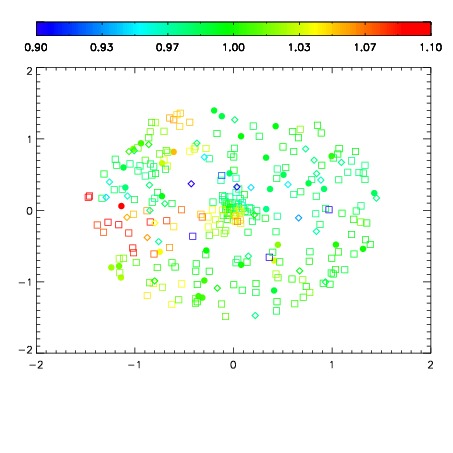
| Spatial sky telluric CO2 absorption deviations (filled: H < 10)
|
| 11150048
| 47
| | Red | Green | Blue
| | z | | 18.80
| | znorm | | 14.62
| | sky | 15.6 | 15.0 | 14.8
| | S/N | 16.4 | 24.8 | 28.1
| | S/N(c) | 14.9 | 24.0 | 27.3
| | SN(E/C) 0.53
|
| 
| 
| 
| 
| 
|
| 11150049
| 47
| | Red | Green | Blue
| | z | | 18.75
| | znorm | | 14.57
| | sky | 15.3 | 14.9 | 15.3
| | S/N | 16.0 | 24.3 | 27.5
| | S/N(c) | 14.6 | 23.5 | 26.7
| | SN(E/C) 0.54
|
| 
| 
| 
| 
| 
|
| 11150050
| 47
| | Red | Green | Blue
| | z | | 18.90
| | znorm | | 14.72
| | sky | 15.0 | 14.8 | 15.3
| | S/N | 17.2 | 26.0 | 29.3
| | S/N(c) | 15.7 | 25.1 | 28.4
| | SN(E/C) 0.50
|
| 
| 
| 
| 
| 
|
| 11150051
| 47
| | Red | Green | Blue
| | z | | 19.02
| | znorm | | 14.84
| | sky | 15.0 | 14.8 | 15.0
| | S/N | 18.6 | 27.9 | 31.2
| | S/N(c) | 17.0 | 27.0 | 30.3
| | SN(E/C) 0.48
|
| 
| 
| 
| 
| 
|
| 11150052
| 47
| | Red | Green | Blue
| | z | | 19.01
| | znorm | | 14.83
| | sky | 15.0 | 14.9 | 15.2
| | S/N | 18.5 | 27.8 | 31.0
| | S/N(c) | 17.0 | 26.9 | 30.1
| | SN(E/C) 0.49
|
| 
| 
| 
| 
| 
|
| 11150053
| 47
| | Red | Green | Blue
| | z | | 18.98
| | znorm | | 14.80
| | sky | 15.1 | 14.9 | 15.1
| | S/N | 18.1 | 27.1 | 30.2
| | S/N(c) | 16.6 | 26.2 | 29.3
| | SN(E/C) 0.50
|
| 
| 
| 
| 
| 
|
| 11150054
| 47
| | Red | Green | Blue
| | z | | 19.04
| | znorm | | 14.86
| | sky | 14.8 | 14.8 | 14.9
| | S/N | 18.7 | 28.0 | 31.2
| | S/N(c) | 17.2 | 27.1 | 30.4
| | SN(E/C) 0.47
|
| 
| 
| 
| 
| 
|
| 11150055
| 47
| | Red | Green | Blue
| | z | | 18.95
| | znorm | | 14.77
| | sky | 15.1 | 15.1 | 15.2
| | S/N | 18.1 | 27.1 | 30.1
| | S/N(c) | 16.4 | 26.1 | 29.3
| | SN(E/C) 0.47
|
| 
| 
| 
| 
| 
|
| 11150056
| 47
| | Red | Green | Blue
| | z | | 18.91
| | znorm | | 14.73
| | sky | 15.2 | 14.9 | 14.9
| | S/N | 17.8 | 26.7 | 29.7
| | S/N(c) | 16.3 | 25.7 | 28.8
| | SN(E/C) 0.50
|
| 
| 
| 
| 
| 
|
| 11150057
| 47
| | Red | Green | Blue
| | z | | 18.63
| | znorm | | 14.45
| | sky | 14.1 | 14.0 | 14.2
| | S/N | 15.1 | 23.1 | 25.7
| | S/N(c) | 13.6 | 22.2 | 24.7
| | SN(E/C) 0.58
|
| 
| 
| 
| 
| 
|