| Red | Green | Blue | |
| z | 17.64 | ||
| znorm | Inf | ||
| sky | -Inf | -Inf | -Inf |
| S/N | 35.7 | 56.7 | 63.6 |
| S/N(c) | 35.7 | 56.7 | 63.6 |
| SN(E/C) |
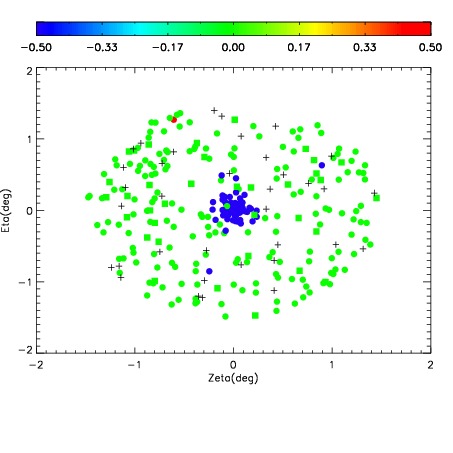
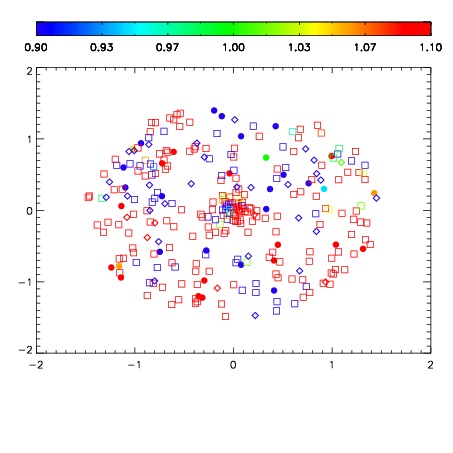
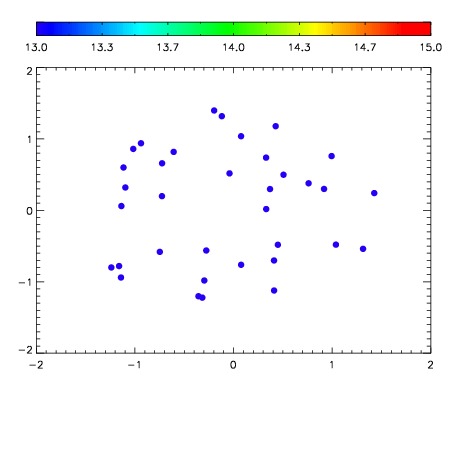

| Frame | Nreads | Zeropoints | Mag plots | Spatial mag deviation | Spatial sky 16325A emission deviations (filled: sky, open: star) | Spatial sky continuum emission | Spatial sky telluric CO2 absorption deviations (filled: H < 10) | |||||||||||||||||||||||
| 0 | 0 |
|
|
|
|
|
|
| IPAIR | NAME | SHIFT | NEWSHIFT | S/N | NAME | SHIFT | NEWSHIFT | S/N |
| 0 | 11150054 | 0.482870 | 0.00000 | 142.342 | 11150051 | -0.000323960 | 0.483194 | 141.572 |
| 1 | 11150053 | 0.481785 | 0.00108501 | 138.945 | 11150052 | 6.24087e-05 | 0.482808 | 140.806 |
| 2 | 11150050 | 0.481606 | 0.00126401 | 135.526 | 11150055 | 0.00150063 | 0.481369 | 134.816 |
| 3 | 11150049 | 0.480496 | 0.00237402 | 127.515 | 11150056 | 0.00125568 | 0.481614 | 132.869 |
| 4 | 11150057 | 0.482707 | 0.000163019 | 114.637 | 11150048 | 0.00000 | 0.482870 | 129.315 |