| Red | Green | Blue | |
| z | 17.64 | ||
| znorm | Inf | ||
| sky | -Inf | -Inf | -Inf |
| S/N | 32.4 | 51.6 | 58.7 |
| S/N(c) | 32.4 | 51.6 | 58.7 |
| SN(E/C) |
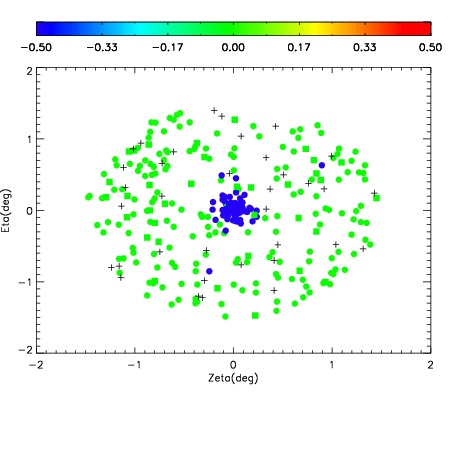
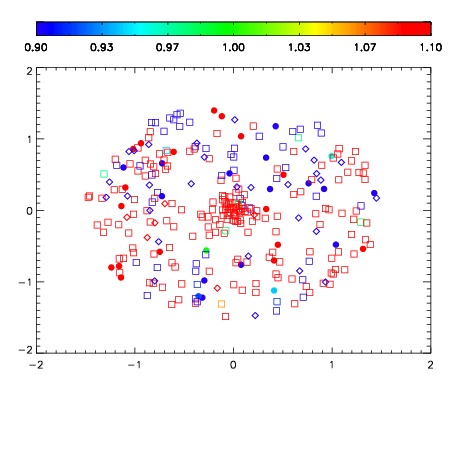
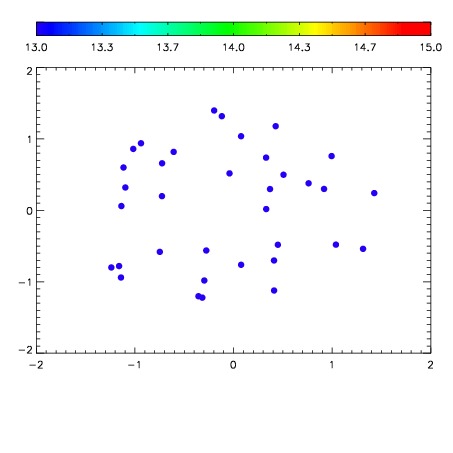

| Frame | Nreads | Zeropoints | Mag plots | Spatial mag deviation | Spatial sky 16325A emission deviations (filled: sky, open: star) | Spatial sky continuum emission | Spatial sky telluric CO2 absorption deviations (filled: H < 10) | |||||||||||||||||||||||
| 0 | 0 |
|
|
|
|
|
|
| IPAIR | NAME | SHIFT | NEWSHIFT | S/N | NAME | SHIFT | NEWSHIFT | S/N |
| 0 | 11380054 | 0.477505 | 0.00000 | 148.806 | 11380052 | -3.74345e-05 | 0.477542 | 149.718 |
| 1 | 11380053 | 0.476263 | 0.00124201 | 147.117 | 11380051 | 4.17475e-05 | 0.477463 | 147.397 |
| 2 | 11380050 | 0.476621 | 0.000883996 | 143.878 | 11380055 | 0.000981601 | 0.476523 | 146.016 |
| 3 | 11380049 | 0.475449 | 0.00205600 | 101.779 | 11380048 | 0.00000 | 0.477505 | 134.537 |