| Red | Green | Blue | |
| z | 17.64 | ||
| znorm | Inf | ||
| sky | -Inf | -Inf | -Inf |
| S/N | 27.4 | 45.0 | 50.7 |
| S/N(c) | 27.4 | 45.0 | 50.7 |
| SN(E/C) |
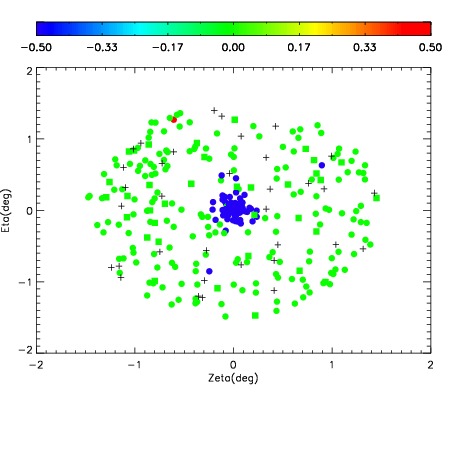


| Frame | Nreads | Zeropoints | Mag plots | Spatial mag deviation | Spatial sky 16325A emission deviations (filled: sky, open: star) | Spatial sky continuum emission | Spatial sky telluric CO2 absorption deviations (filled: H < 10) | |||||||||||||||||||||||
| 0 | 0 |
|
|
|
|
|
|
| IPAIR | NAME | SHIFT | NEWSHIFT | S/N | NAME | SHIFT | NEWSHIFT | S/N |
| 0 | 11720027 | 0.494768 | 0.00000 | 119.849 | 11720029 | 0.000581259 | 0.494187 | 118.837 |
| 1 | 11720028 | 0.494522 | 0.000245988 | 123.431 | 11720026 | 0.00000 | 0.494768 | 122.379 |
| 2 | 11720031 | 0.493714 | 0.00105399 | 114.090 | 11720030 | 0.000392352 | 0.494376 | 109.933 |
| 3 | 11720032 | 0.493170 | 0.00159800 | 106.807 | 11720033 | -0.00127578 | 0.496044 | 103.075 |