| Red | Green | Blue | |
| z | 17.64 | ||
| znorm | Inf | ||
| sky | -Inf | -Inf | -Inf |
| S/N | 45.4 | 73.0 | 82.4 |
| S/N(c) | 45.4 | 73.0 | 82.4 |
| SN(E/C) |
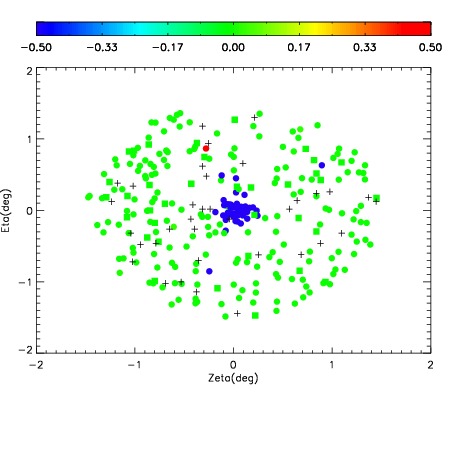
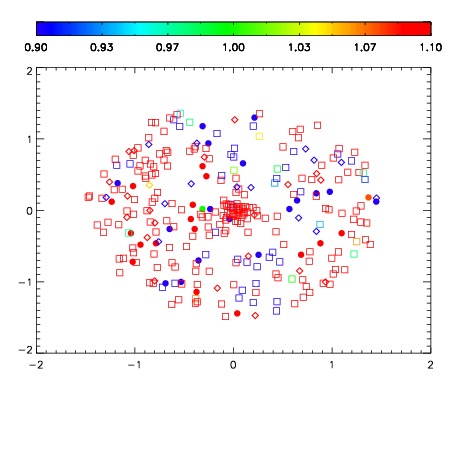
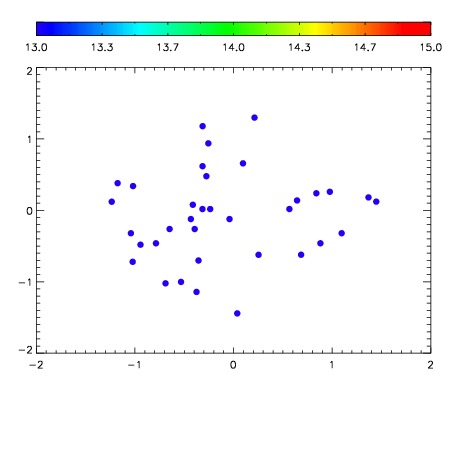

| Frame | Nreads | Zeropoints | Mag plots | Spatial mag deviation | Spatial sky 16325A emission deviations (filled: sky, open: star) | Spatial sky continuum emission | Spatial sky telluric CO2 absorption deviations (filled: H < 10) | |||||||||||||||||||||||
| 0 | 0 |
|
|
|
|
|
|
| IPAIR | NAME | SHIFT | NEWSHIFT | S/N | NAME | SHIFT | NEWSHIFT | S/N |
| 0 | 10880105 | 0.506019 | 0.00000 | 119.469 | 10880099 | -0.000558389 | 0.506577 | 115.818 |
| 1 | 10880093 | 0.502517 | 0.00350201 | 142.292 | 10880094 | -0.00236918 | 0.508388 | 141.971 |
| 2 | 10880092 | 0.501168 | 0.00485098 | 136.337 | 10880091 | 0.00000 | 0.506019 | 135.962 |
| 3 | 10880100 | 0.504020 | 0.00199902 | 124.112 | 10880095 | -0.00129446 | 0.507313 | 131.919 |
| 4 | 10880101 | 0.504714 | 0.00130498 | 123.148 | 10880103 | 0.000620280 | 0.505399 | 131.372 |
| 5 | 10880104 | 0.505221 | 0.000797987 | 119.916 | 10880102 | 0.000196927 | 0.505822 | 123.499 |
| 6 | 10880096 | 0.501227 | 0.00479198 | 115.130 | 10880106 | 0.000671871 | 0.505347 | 112.528 |
| 7 | 10880097 | 0.502427 | 0.00359201 | 112.385 | 10880098 | -0.000506947 | 0.506526 | 109.968 |