| Red | Green | Blue | |
| z | 17.64 | ||
| znorm | Inf | ||
| sky | -Inf | -Inf | -Inf |
| S/N | 29.6 | 47.2 | 52.3 |
| S/N(c) | 29.6 | 47.2 | 52.3 |
| SN(E/C) |
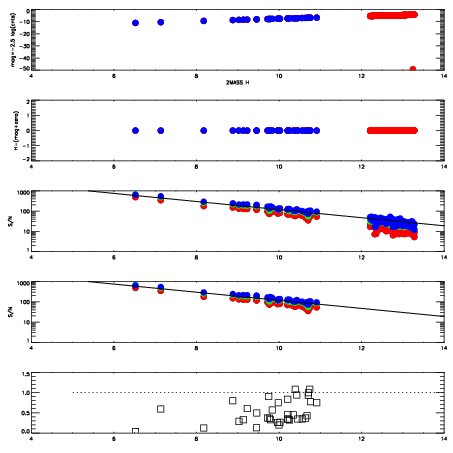
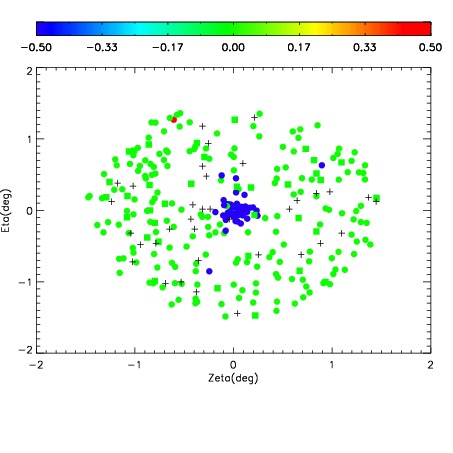
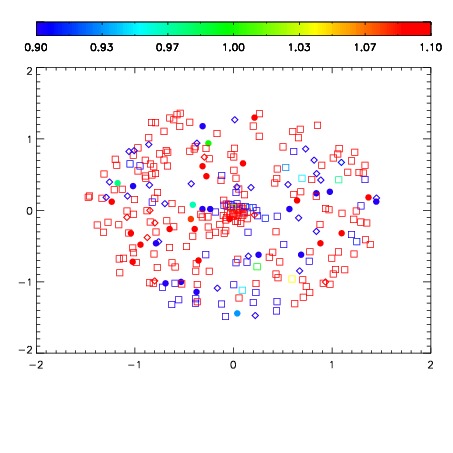
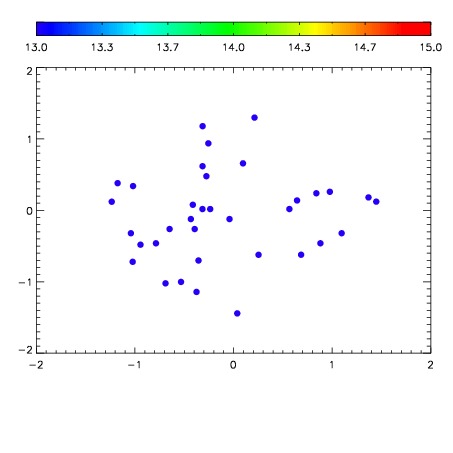

| Frame | Nreads | Zeropoints | Mag plots | Spatial mag deviation | Spatial sky 16325A emission deviations (filled: sky, open: star) | Spatial sky continuum emission | Spatial sky telluric CO2 absorption deviations (filled: H < 10) | |||||||||||||||||||||||
| 0 | 0 |
|
|
|
|
|
|
| IPAIR | NAME | SHIFT | NEWSHIFT | S/N | NAME | SHIFT | NEWSHIFT | S/N |
| 0 | 11090092 | 0.476015 | 0.00000 | 117.494 | 11090090 | -0.000176575 | 0.476192 | 123.823 |
| 1 | 11090087 | 0.472910 | 0.00310501 | 136.554 | 11090089 | -0.000637045 | 0.476652 | 129.807 |
| 2 | 11090088 | 0.473509 | 0.00250599 | 132.261 | 11090086 | 0.00000 | 0.476015 | 128.025 |
| 3 | 11090091 | 0.475055 | 0.000959992 | 131.069 | 11090093 | -0.000411352 | 0.476426 | 124.687 |