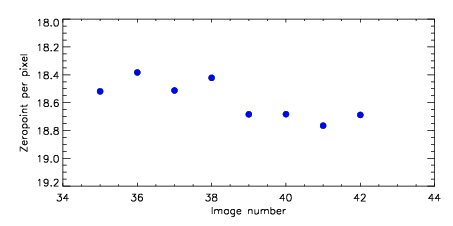
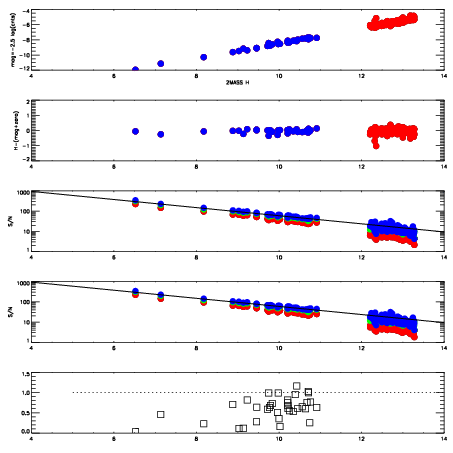
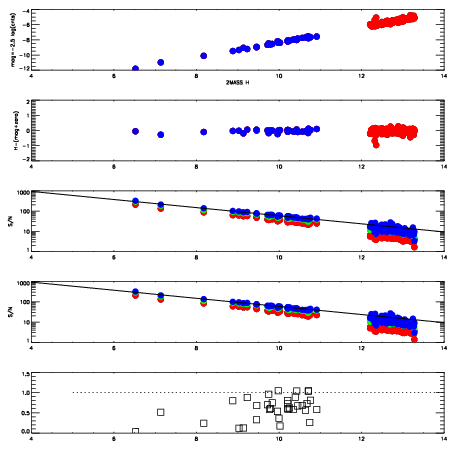
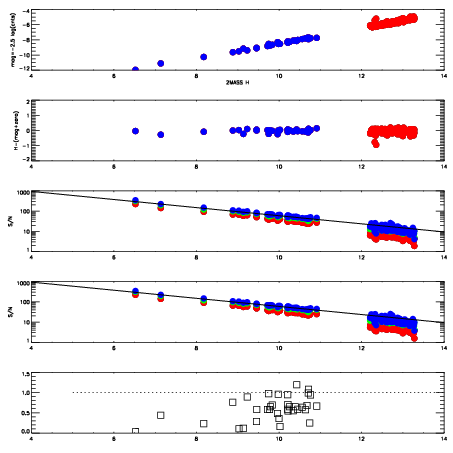
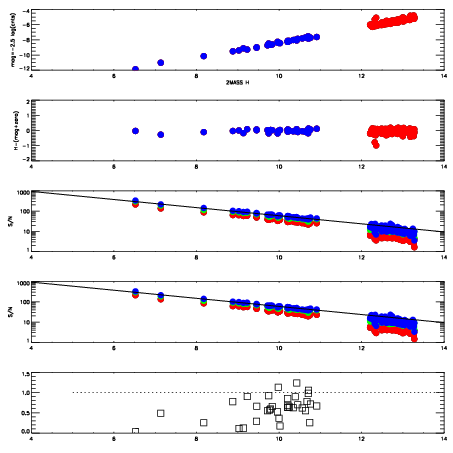
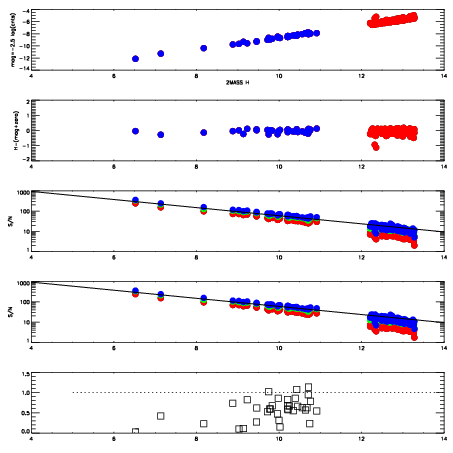
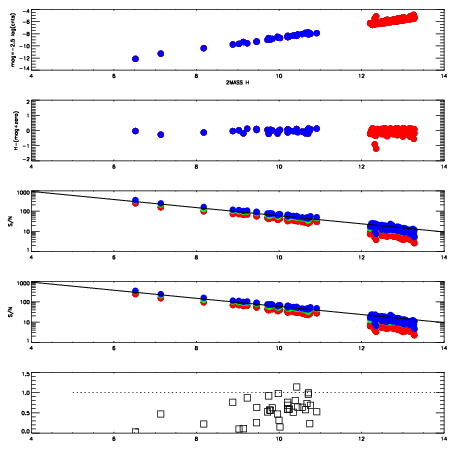
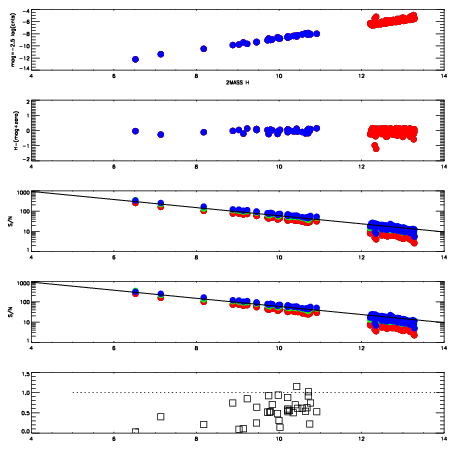
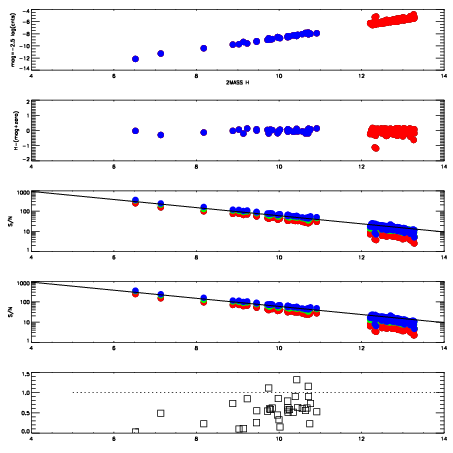
| Frame | Nreads | Zeropoints | Mag plots
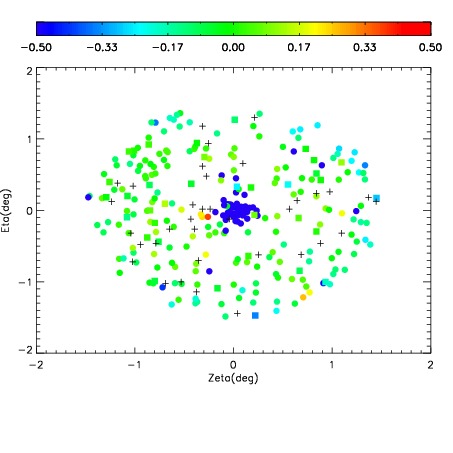
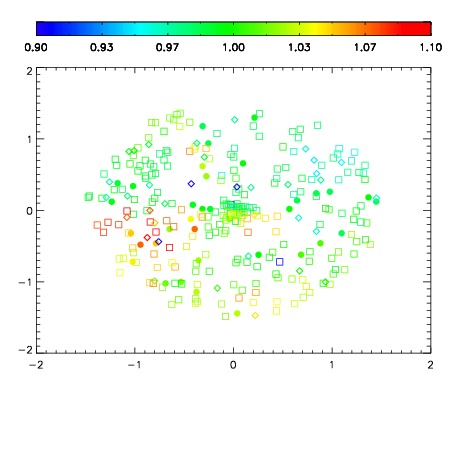
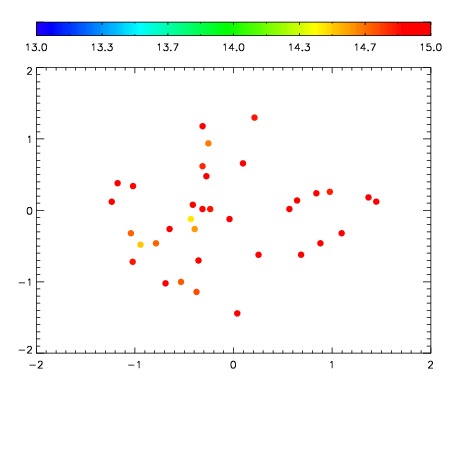
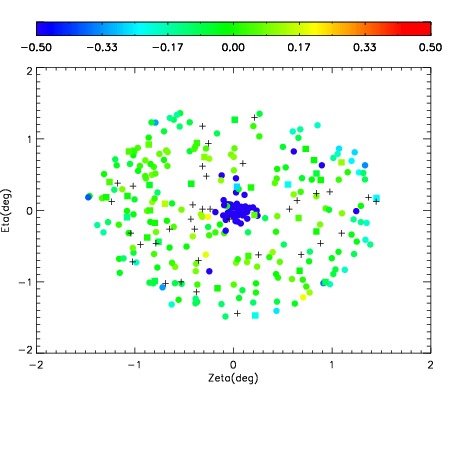
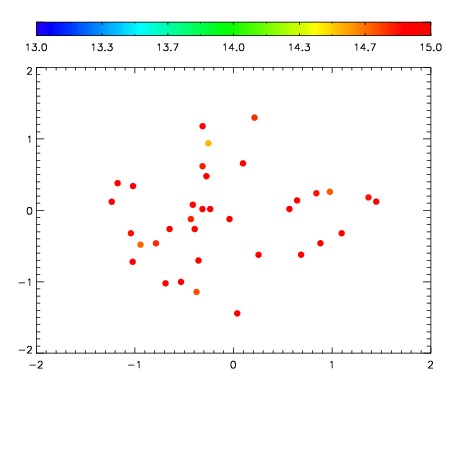
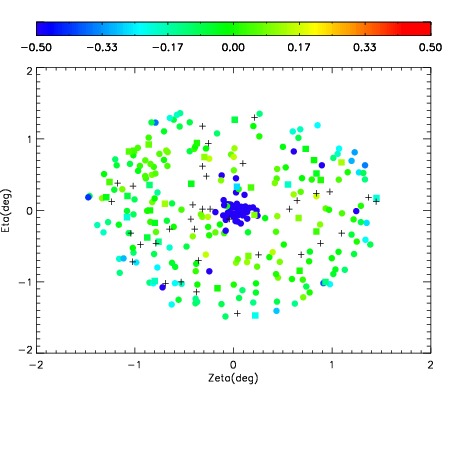
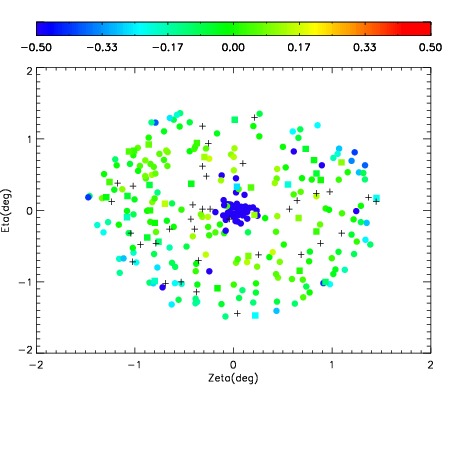
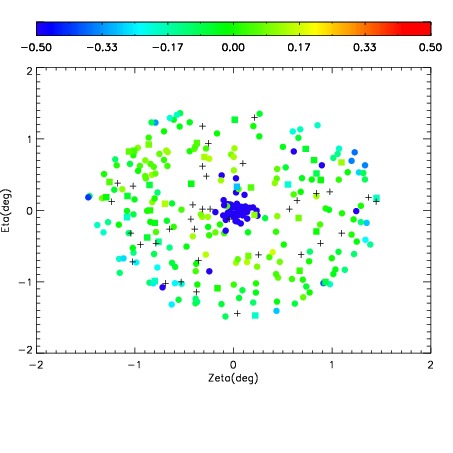
| Spatial mag deviation
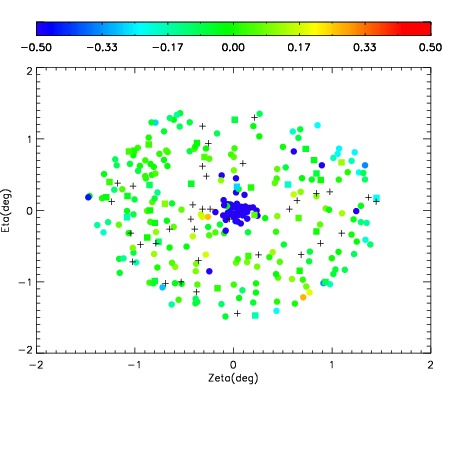
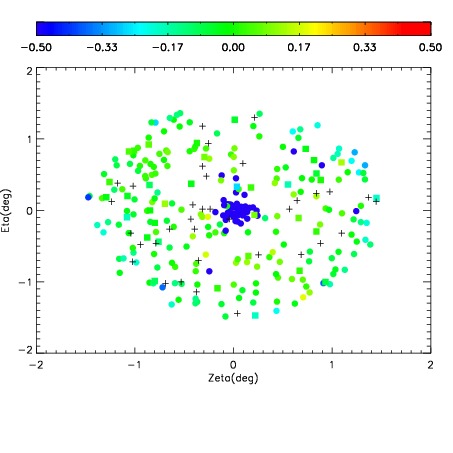
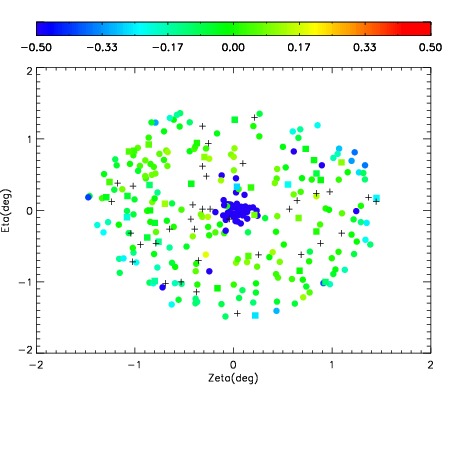
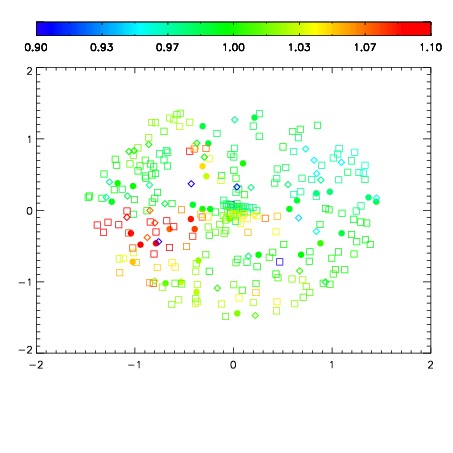
| Spatial sky 16325A emission deviations (filled: sky, open: star)
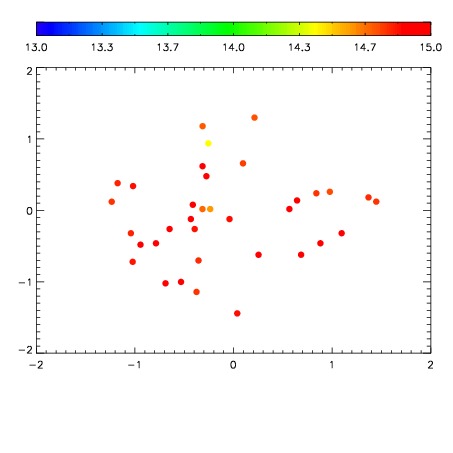
| Spatial sky continuum emission
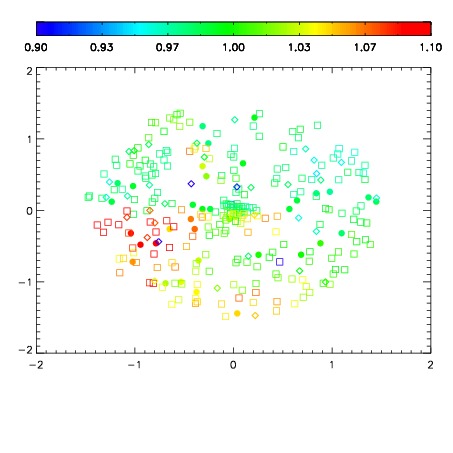
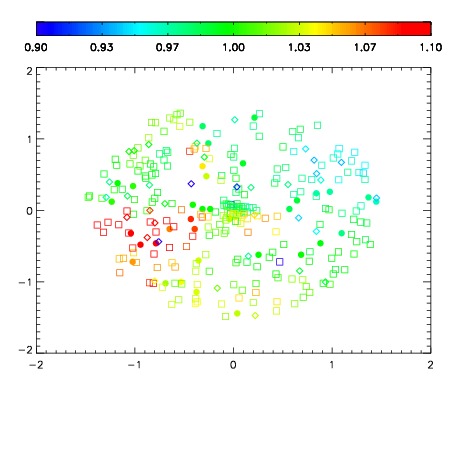
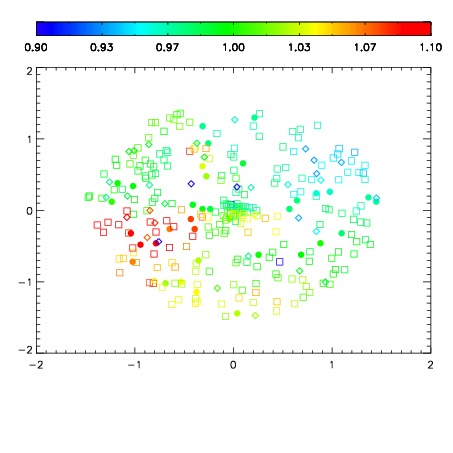
| Spatial sky telluric CO2 absorption deviations (filled: H < 10)
|
| 11160035
| 47
| | Red | Green | Blue
| | z | | 18.52
| | znorm | | 14.34
| | sky | 15.5 | 15.0 | 14.8
| | S/N | 15.1 | 23.2 | 25.6
| | S/N(c) | 13.8 | 22.5 | 24.6
| | SN(E/C) 0.63
|
| 
| 
| 
| 
| 
|
| 11160036
| 47
| | Red | Green | Blue
| | z | | 18.38
| | znorm | | 14.20
| | sky | 15.3 | 14.9 | 15.2
| | S/N | 13.6 | 21.3 | 23.6
| | S/N(c) | 12.3 | 20.6 | 22.6
| | SN(E/C) 0.62
|
| 
| 
| 
| 
| 
|
| 11160037
| 47
| | Red | Green | Blue
| | z | | 18.51
| | znorm | | 14.33
| | sky | 15.6 | 14.9 | 15.0
| | S/N | 15.0 | 23.3 | 25.8
| | S/N(c) | 13.7 | 22.4 | 24.7
| | SN(E/C) 0.58
|
| 
| 
| 
| 
| 
|
| 11160038
| 47
| | Red | Green | Blue
| | z | | 18.42
| | znorm | | 14.24
| | sky | 15.4 | 14.9 | 15.0
| | S/N | 14.0 | 21.9 | 24.2
| | S/N(c) | 12.7 | 21.0 | 23.2
| | SN(E/C) 0.63
|
| 
| 
| 
| 
| 
|
| 11160039
| 47
| | Red | Green | Blue
| | z | | 18.68
| | znorm | | 14.50
| | sky | 15.4 | 14.9 | 15.0
| | S/N | 16.4 | 25.0 | 27.9
| | S/N(c) | 15.0 | 24.1 | 26.7
| | SN(E/C) 0.60
|
| 
| 
| 
| 
| 
|
| 11160040
| 47
| | Red | Green | Blue
| | z | | 18.68
| | znorm | | 14.50
| | sky | 15.2 | 14.9 | 14.8
| | S/N | 16.4 | 25.1 | 27.8
| | S/N(c) | 15.0 | 24.1 | 26.7
| | SN(E/C) 0.58
|
| 
| 
| 
| 
| 
|
| 11160041
| 47
| | Red | Green | Blue
| | z | | 18.77
| | znorm | | 14.59
| | sky | 15.0 | 14.9 | 14.9
| | S/N | 17.3 | 26.4 | 29.3
| | S/N(c) | 15.9 | 25.4 | 28.0
| | SN(E/C) 0.56
|
| 
| 
| 
| 
| 
|
| 11160042
| 47
| | Red | Green | Blue
| | z | | 18.69
| | znorm | | 14.51
| | sky | 14.9 | 14.8 | 14.8
| | S/N | 16.4 | 25.2 | 28.0
| | S/N(c) | 15.0 | 24.2 | 26.8
| | SN(E/C) 0.58
|
| 
| 
| 
| 
| 
|