| Red | Green | Blue | |
| z | 17.64 | ||
| znorm | Inf | ||
| sky | -Inf | -Inf | -Inf |
| S/N | 28.4 | 46.2 | 50.9 |
| S/N(c) | 28.4 | 46.2 | 50.9 |
| SN(E/C) |
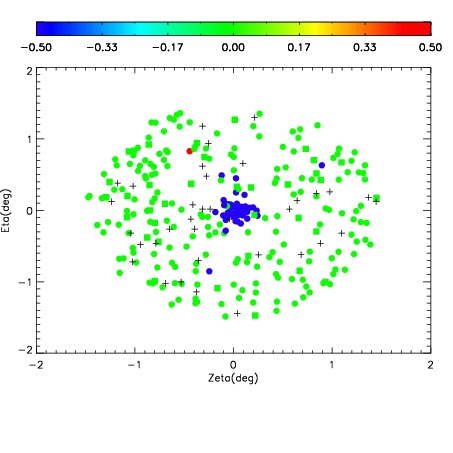
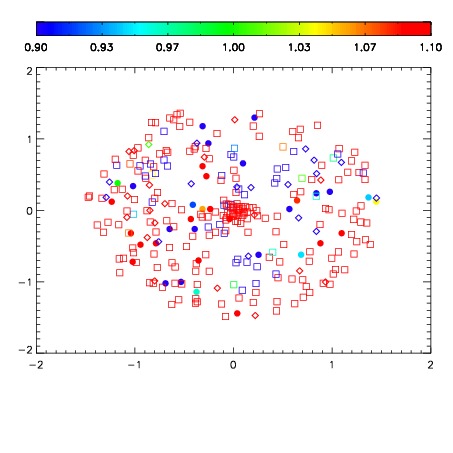
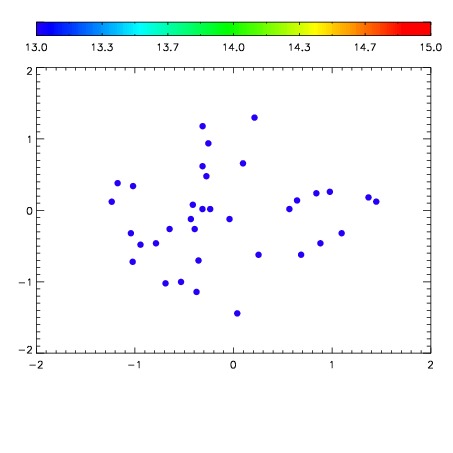

| Frame | Nreads | Zeropoints | Mag plots | Spatial mag deviation | Spatial sky 16325A emission deviations (filled: sky, open: star) | Spatial sky continuum emission | Spatial sky telluric CO2 absorption deviations (filled: H < 10) | |||||||||||||||||||||||
| 0 | 0 |
|
|
|
|
|
|
| IPAIR | NAME | SHIFT | NEWSHIFT | S/N | NAME | SHIFT | NEWSHIFT | S/N |
| 0 | 11160041 | 0.486426 | 0.00000 | 131.228 | 11160042 | 0.00620827 | 0.480218 | 125.395 |
| 1 | 11160040 | 0.486004 | 0.000422001 | 125.234 | 11160039 | 0.000712300 | 0.485714 | 124.787 |
| 2 | 11160037 | 0.485358 | 0.00106800 | 118.422 | 11160035 | 0.00000 | 0.486426 | 120.281 |
| 3 | 11160036 | 0.484414 | 0.00201198 | 110.545 | 11160038 | 0.000457733 | 0.485968 | 112.176 |