| Red | Green | Blue | |
| z | 17.64 | ||
| znorm | Inf | ||
| sky | -Inf | -Inf | -Inf |
| S/N | 26.8 | 44.0 | 50.4 |
| S/N(c) | 26.8 | 44.0 | 50.4 |
| SN(E/C) |
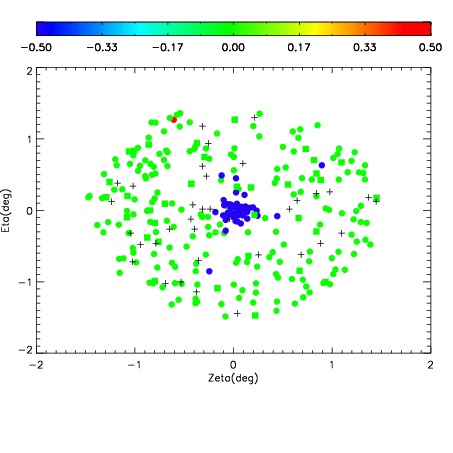
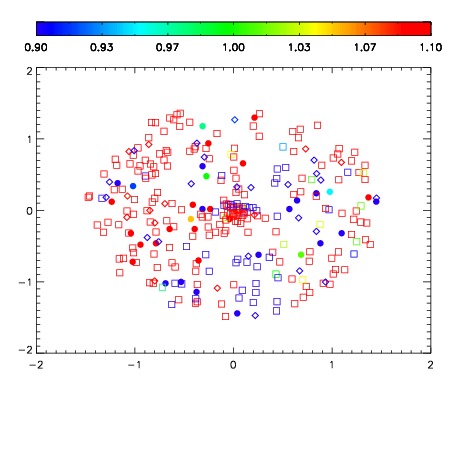
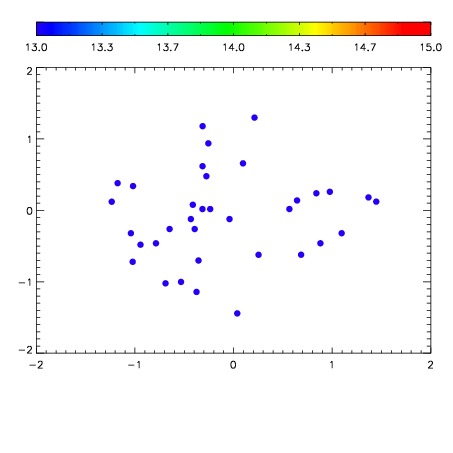

| Frame | Nreads | Zeropoints | Mag plots | Spatial mag deviation | Spatial sky 16325A emission deviations (filled: sky, open: star) | Spatial sky continuum emission | Spatial sky telluric CO2 absorption deviations (filled: H < 10) | |||||||||||||||||||||||
| 0 | 0 |
|
|
|
|
|
|
| IPAIR | NAME | SHIFT | NEWSHIFT | S/N | NAME | SHIFT | NEWSHIFT | S/N |
| 0 | 11450024 | 0.478403 | 0.00000 | 130.393 | 11450022 | 0.00000 | 0.478403 | 139.970 |
| 1 | 11450027 | 0.475991 | 0.00241199 | 151.758 | 11450026 | -0.000672519 | 0.479076 | 155.040 |
| 2 | 11450028 | 0.476845 | 0.00155801 | 138.495 | 11450029 | 0.00105734 | 0.477346 | 143.838 |
| 3 | 11450023 | 0.478052 | 0.000351012 | 128.993 | 11450025 | -0.000266111 | 0.478669 | 133.315 |