| Red | Green | Blue | |
| z | 17.64 | ||
| znorm | Inf | ||
| sky | -Inf | -Inf | -Inf |
| S/N | 50.0 | 78.0 | 86.5 |
| S/N(c) | 50.0 | 78.0 | 86.5 |
| SN(E/C) |
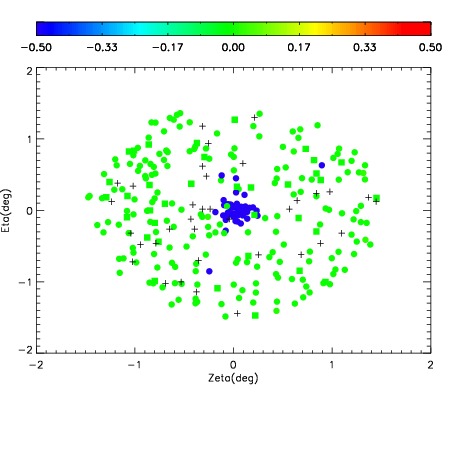
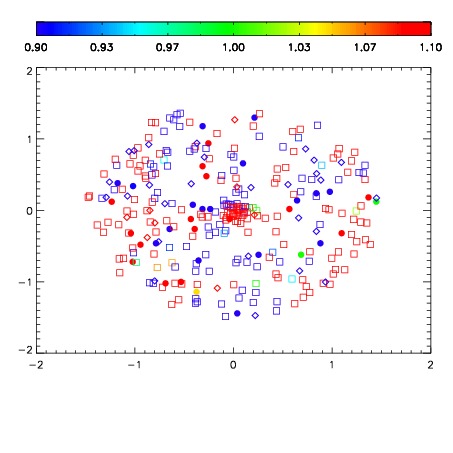
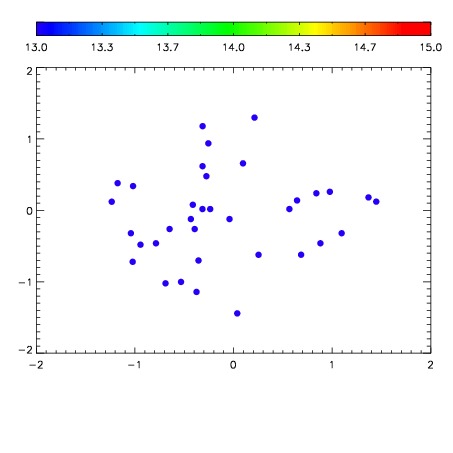

| Frame | Nreads | Zeropoints | Mag plots | Spatial mag deviation | Spatial sky 16325A emission deviations (filled: sky, open: star) | Spatial sky continuum emission | Spatial sky telluric CO2 absorption deviations (filled: H < 10) | |||||||||||||||||||||||
| 0 | 0 |
|
|
|
|
|
|
| IPAIR | NAME | SHIFT | NEWSHIFT | S/N | NAME | SHIFT | NEWSHIFT | S/N |
| 0 | 11650023 | 0.494403 | 0.00000 | 150.904 | 11650025 | -0.00122118 | 0.495624 | 149.986 |
| 1 | 11650032 | 0.493447 | 0.000955999 | 158.217 | 11650030 | -0.00182270 | 0.496226 | 161.734 |
| 2 | 11650035 | 0.493824 | 0.000579000 | 155.150 | 11650034 | -0.00124475 | 0.495648 | 158.719 |
| 3 | 11650028 | 0.493454 | 0.000948995 | 154.100 | 11650033 | -0.00133803 | 0.495741 | 157.216 |
| 4 | 11650031 | 0.493618 | 0.000784993 | 152.804 | 11650022 | 0.00000 | 0.494403 | 153.728 |
| 5 | 11650024 | 0.494383 | 1.99974e-05 | 151.901 | 11650029 | -0.00217177 | 0.496575 | 152.701 |
| 6 | 11650027 | 0.493352 | 0.00105101 | 140.871 | 11650026 | -0.000825309 | 0.495228 | 132.243 |