| Red | Green | Blue | |
| z | 17.64 | ||
| znorm | Inf | ||
| sky | -NaN | -NaN | -Inf |
| S/N | 25.6 | 41.5 | 46.2 |
| S/N(c) | 25.6 | 41.5 | 46.2 |
| SN(E/C) |
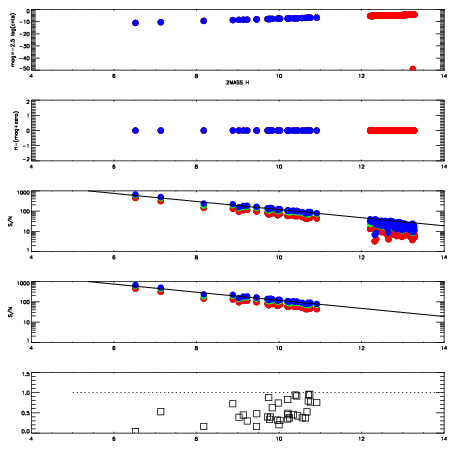
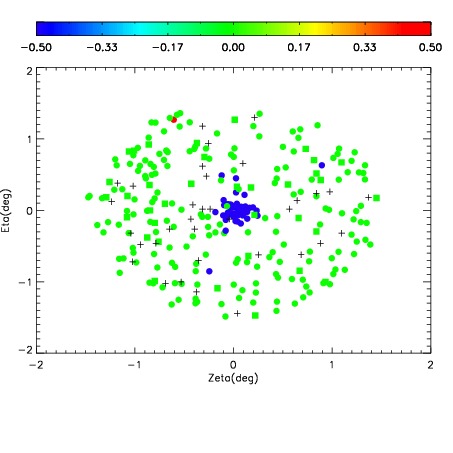
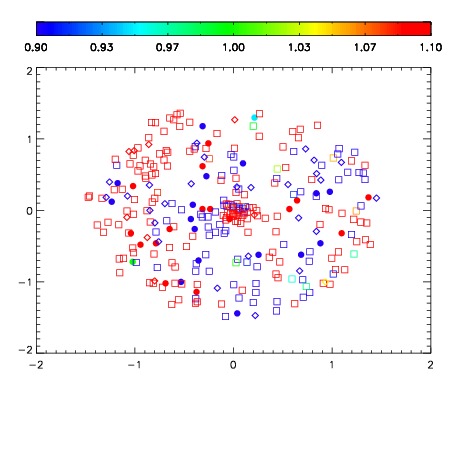

| Frame | Nreads | Zeropoints | Mag plots | Spatial mag deviation | Spatial sky 16325A emission deviations (filled: sky, open: star) | Spatial sky continuum emission | Spatial sky telluric CO2 absorption deviations (filled: H < 10) | |||||||||||||||||||||||
| 0 | 0 |
|
|
|
|
|
|
| IPAIR | NAME | SHIFT | NEWSHIFT | S/N | NAME | SHIFT | NEWSHIFT | S/N |
| 0 | 11970028 | 0.504331 | 0.00000 | 89.4522 | 11970029 | 0.000495555 | 0.503835 | 85.0340 |
| 1 | 11970024 | 0.501575 | 0.00275600 | 95.0165 | 11970026 | -0.000271311 | 0.504602 | 104.882 |
| 2 | 11970027 | 0.504150 | 0.000181019 | 94.1491 | 11970025 | -0.000854065 | 0.505185 | 98.6148 |
| 3 | 11970023 | 0.501193 | 0.00313801 | 89.7314 | 11970022 | 0.00000 | 0.504331 | 92.9169 |