| Red | Green | Blue | |
| z | 17.64 | ||
| znorm | Inf | ||
| sky | -Inf | -Inf | -Inf |
| S/N | 41.0 | 65.9 | 73.6 |
| S/N(c) | 41.0 | 65.9 | 73.6 |
| SN(E/C) |

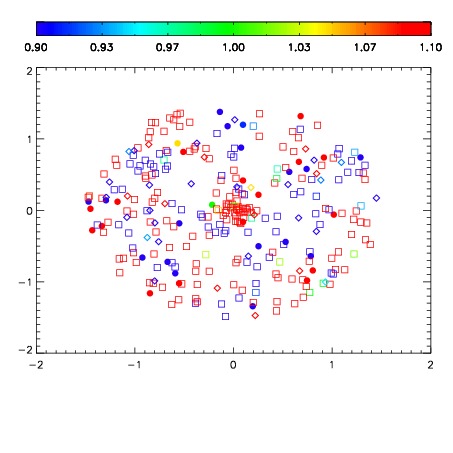
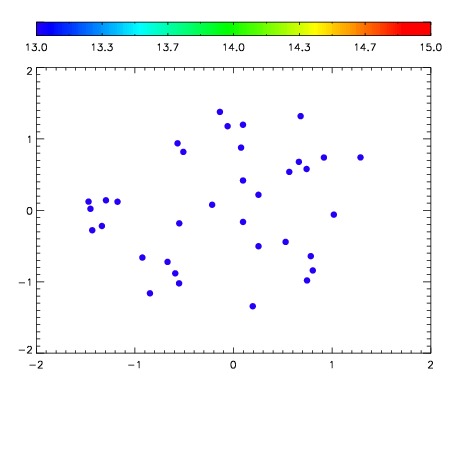

| Frame | Nreads | Zeropoints | Mag plots | Spatial mag deviation | Spatial sky 16325A emission deviations (filled: sky, open: star) | Spatial sky continuum emission | Spatial sky telluric CO2 absorption deviations (filled: H < 10) | |||||||||||||||||||||||
| 0 | 0 |
|
|
|
|
|
|
| IPAIR | NAME | SHIFT | NEWSHIFT | S/N | NAME | SHIFT | NEWSHIFT | S/N |
| 0 | 10890109 | 0.511799 | 0.00000 | 138.846 | 10890104 | -0.00261994 | 0.514419 | 134.605 |
| 1 | 10890098 | 0.507889 | 0.00391001 | 166.919 | 10890100 | -0.00449818 | 0.516297 | 160.714 |
| 2 | 10890097 | 0.507304 | 0.00449497 | 157.313 | 10890099 | -0.00442716 | 0.516226 | 159.522 |
| 3 | 10890101 | 0.508043 | 0.00375599 | 156.787 | 10890096 | 0.00000 | 0.511799 | 155.156 |
| 4 | 10890105 | 0.509541 | 0.00225800 | 142.229 | 10890107 | -0.00112399 | 0.512923 | 149.897 |
| 5 | 10890106 | 0.509358 | 0.00244099 | 140.666 | 10890108 | -8.94136e-05 | 0.511888 | 142.969 |
| 6 | 10890102 | 0.508770 | 0.00302899 | 131.655 | 10890103 | -0.00357780 | 0.515377 | 130.176 |