| Red | Green | Blue | |
| z | 17.64 | ||
| znorm | Inf | ||
| sky | -Inf | -NaN | -Inf |
| S/N | 36.9 | 57.1 | 64.1 |
| S/N(c) | 36.9 | 57.1 | 64.1 |
| SN(E/C) |
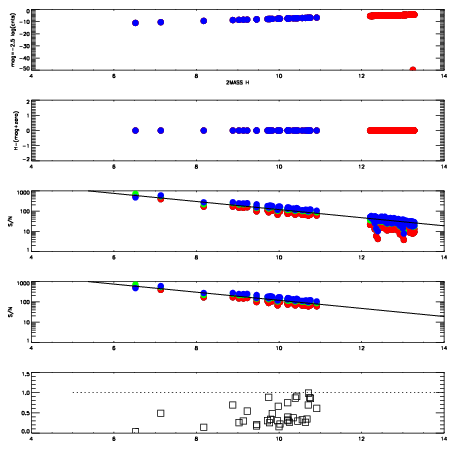
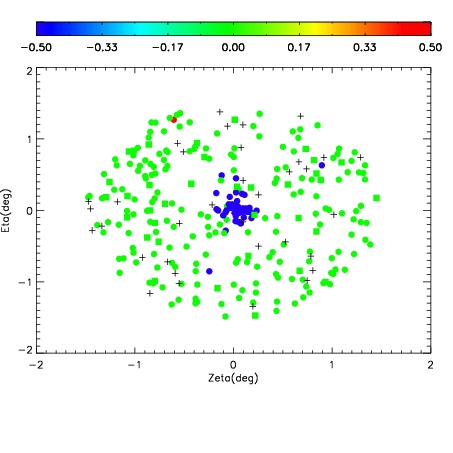
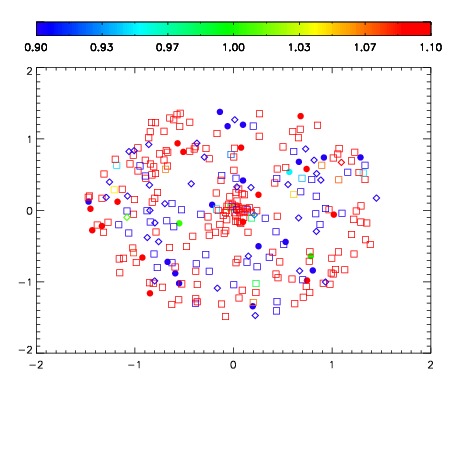
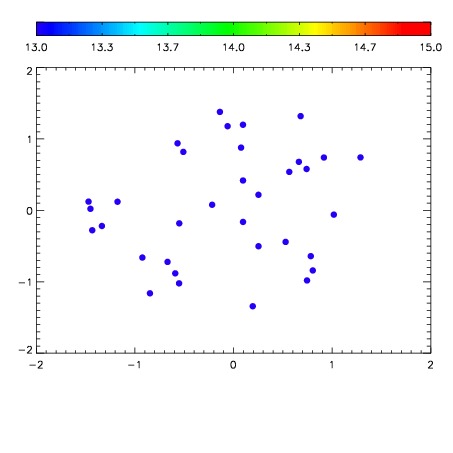

| Frame | Nreads | Zeropoints | Mag plots | Spatial mag deviation | Spatial sky 16325A emission deviations (filled: sky, open: star) | Spatial sky continuum emission | Spatial sky telluric CO2 absorption deviations (filled: H < 10) | |||||||||||||||||||||||
| 0 | 0 |
|
|
|
|
|
|
| IPAIR | NAME | SHIFT | NEWSHIFT | S/N | NAME | SHIFT | NEWSHIFT | S/N |
| 0 | 11410061 | 0.480236 | 0.00000 | 110.515 | 11410062 | 0.000654833 | 0.479581 | 110.931 |
| 1 | 11410060 | 0.479884 | 0.000351995 | 110.108 | 11410059 | -0.000934540 | 0.481171 | 110.090 |
| 2 | 11410057 | 0.478856 | 0.00138000 | 107.423 | 11410058 | -0.00119879 | 0.481435 | 108.688 |
| 3 | 11410056 | 0.479007 | 0.00122899 | 106.456 | 11410055 | 0.00000 | 0.480236 | 107.642 |