| Red | Green | Blue | |
| z | 17.64 | ||
| znorm | Inf | ||
| sky | -Inf | -NaN | -Inf |
| S/N | 33.1 | 52.3 | 57.6 |
| S/N(c) | 33.1 | 52.3 | 57.6 |
| SN(E/C) |
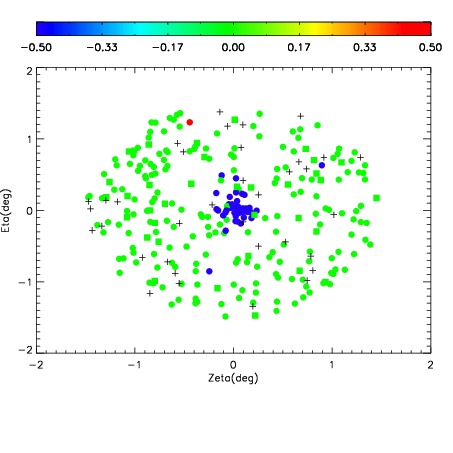
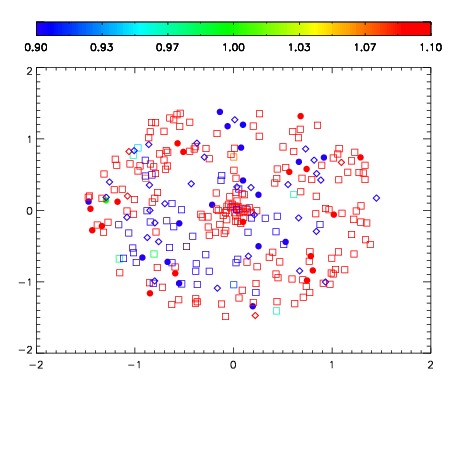
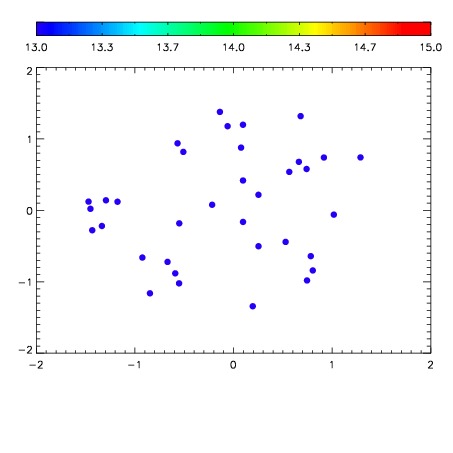

| Frame | Nreads | Zeropoints | Mag plots | Spatial mag deviation | Spatial sky 16325A emission deviations (filled: sky, open: star) | Spatial sky continuum emission | Spatial sky telluric CO2 absorption deviations (filled: H < 10) | |||||||||||||||||||||||
| 0 | 0 |
|
|
|
|
|
|
| IPAIR | NAME | SHIFT | NEWSHIFT | S/N | NAME | SHIFT | NEWSHIFT | S/N |
| 0 | 12250017 | 0.493032 | 0.00000 | 151.152 | 12250015 | -3.39479e-06 | 0.493035 | 150.949 |
| 1 | 12250013 | 0.492613 | 0.000419021 | 156.721 | 12250011 | 0.00000 | 0.493032 | 154.003 |
| 2 | 12250012 | 0.492373 | 0.000659019 | 151.421 | 12250014 | 5.28060e-05 | 0.492979 | 153.524 |
| 3 | 12250016 | 0.492405 | 0.000627011 | 148.805 | 12250018 | 0.00161616 | 0.491416 | 144.334 |