| Red | Green | Blue | |
| z | 17.64 | ||
| znorm | Inf | ||
| sky | -Inf | -Inf | -Inf |
| S/N | 21.5 | 41.6 | 42.9 |
| S/N(c) | 0.0 | 0.0 | 0.0 |
| SN(E/C) |
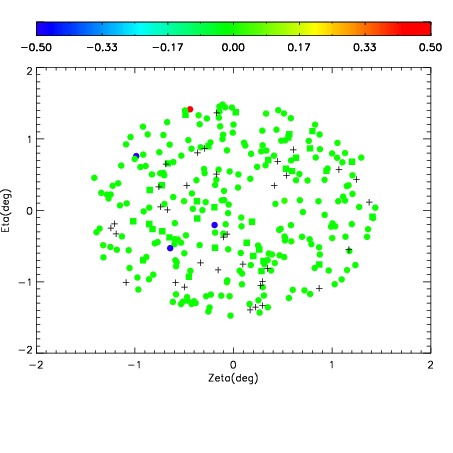

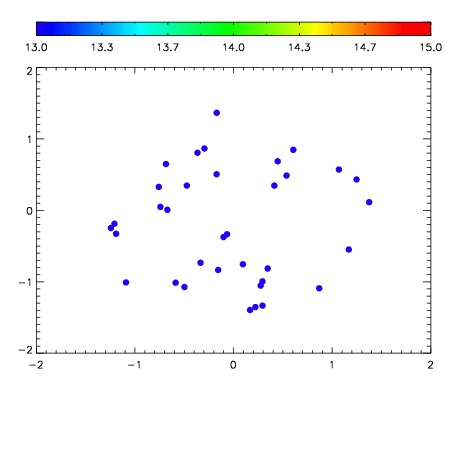

| Frame | Nreads | Zeropoints | Mag plots | Spatial mag deviation | Spatial sky 16325A emission deviations (filled: sky, open: star) | Spatial sky continuum emission | Spatial sky telluric CO2 absorption deviations (filled: H < 10) | |||||||||||||||||||||||
| 0 | 0 |
|
|
|
|
|
|
| IPAIR | NAME | SHIFT | NEWSHIFT | S/N | NAME | SHIFT | NEWSHIFT | S/N |
| 0 | 11110091 | 0.486078 | 0.00000 | 139.422 | 11110089 | -0.000437723 | 0.486516 | 140.913 |
| 1 | 11110086 | 0.481397 | 0.00468099 | 178.332 | 11110085 | -0.00158040 | 0.487658 | 164.329 |
| 2 | 11110082 | 0.480494 | 0.00558400 | 169.959 | 11110084 | -0.00143770 | 0.487516 | 162.417 |
| 3 | 11110083 | 0.480600 | 0.00547799 | 164.400 | 11110081 | 0.00000 | 0.486078 | 159.264 |
| 4 | 11110087 | 0.482927 | 0.00315100 | 148.710 | 11110088 | -0.000493427 | 0.486571 | 158.881 |
| 5 | 11110090 | 0.485074 | 0.00100398 | 146.073 | 11110092 | 0.00103793 | 0.485040 | 153.767 |