| Red | Green | Blue | |
| z | 17.64 | ||
| znorm | Inf | ||
| sky | -Inf | -Inf | -Inf |
| S/N | 23.9 | 38.3 | 42.8 |
| S/N(c) | 0.0 | 0.0 | 0.0 |
| SN(E/C) |
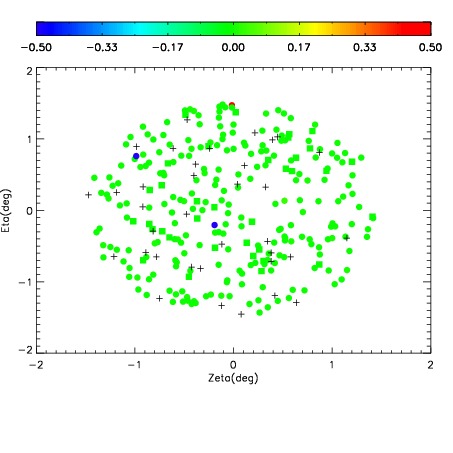

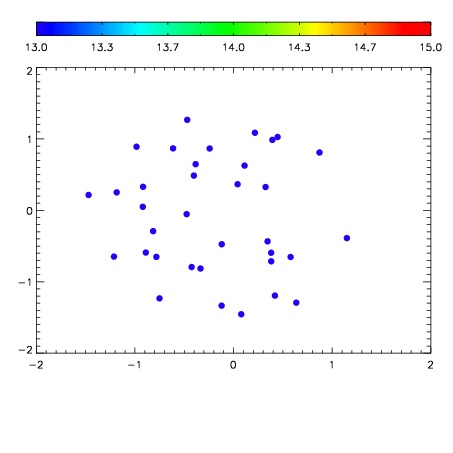

| Frame | Nreads | Zeropoints | Mag plots | Spatial mag deviation | Spatial sky 16325A emission deviations (filled: sky, open: star) | Spatial sky continuum emission | Spatial sky telluric CO2 absorption deviations (filled: H < 10) | |||||||||||||||||||||||
| 0 | 0 |
|
|
|
|
|
|
| IPAIR | NAME | SHIFT | NEWSHIFT | S/N | NAME | SHIFT | NEWSHIFT | S/N |
| 0 | 12610017 | 0.489971 | 0.00000 | 188.848 | 12610011 | 0.00000 | 0.489971 | 189.186 |
| 1 | 12610013 | 0.487651 | 0.00232002 | 185.384 | 12610015 | -0.00145255 | 0.491424 | 183.683 |
| 2 | 12610016 | 0.488962 | 0.00100902 | 184.609 | 12610014 | -0.00208534 | 0.492056 | 182.286 |
| 3 | 12610012 | 0.486717 | 0.00325403 | 180.469 | 12610018 | 0.000303380 | 0.489668 | 181.843 |