| Red | Green | Blue | |
| z | 17.64 | ||
| znorm | Inf | ||
| sky | -Inf | -Inf | -Inf |
| S/N | 25.9 | 44.7 | 48.1 |
| S/N(c) | 0.0 | 0.0 | 0.0 |
| SN(E/C) |
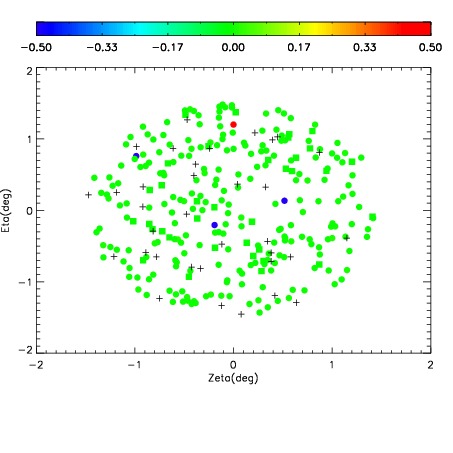

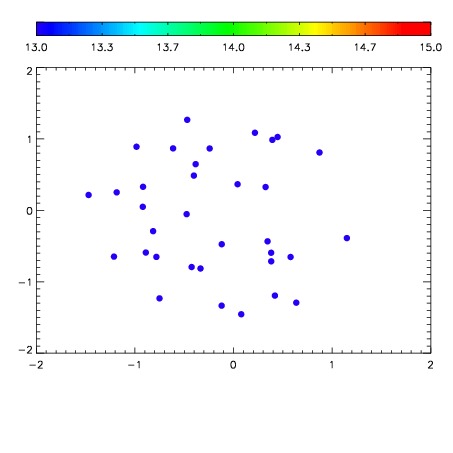

| Frame | Nreads | Zeropoints | Mag plots | Spatial mag deviation | Spatial sky 16325A emission deviations (filled: sky, open: star) | Spatial sky continuum emission | Spatial sky telluric CO2 absorption deviations (filled: H < 10) | |||||||||||||||||||||||
| 0 | 0 |
|
|
|
|
|
|
| IPAIR | NAME | SHIFT | NEWSHIFT | S/N | NAME | SHIFT | NEWSHIFT | S/N |
| 0 | 12680017 | 0.489562 | 0.00000 | 192.362 | 12680018 | -0.000103991 | 0.489666 | 192.544 |
| 1 | 12680012 | 0.489105 | 0.000457019 | 200.422 | 12680011 | 0.00000 | 0.489562 | 201.441 |
| 2 | 12680013 | 0.488571 | 0.000991017 | 193.410 | 12680015 | -0.00279827 | 0.492360 | 193.283 |
| 3 | 12680016 | 0.489167 | 0.000395000 | 192.495 | 12680014 | -0.00251658 | 0.492079 | 192.748 |