| Red | Green | Blue | |
| z | 17.64 | ||
| znorm | Inf | ||
| sky | -Inf | -Inf | -Inf |
| S/N | 22.2 | 37.3 | 42.4 |
| S/N(c) | 0.0 | 0.0 | 0.0 |
| SN(E/C) |

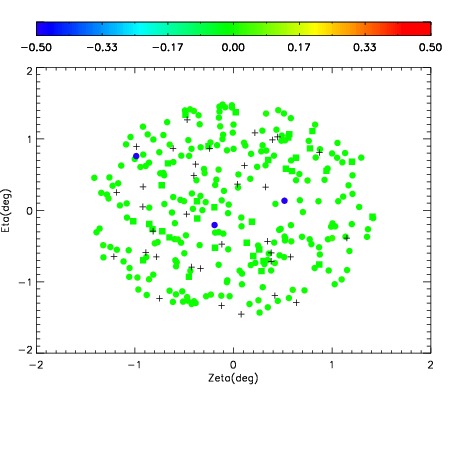
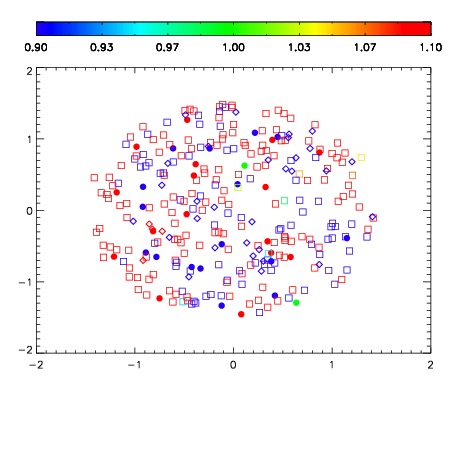


| Frame | Nreads | Zeropoints | Mag plots | Spatial mag deviation | Spatial sky 16325A emission deviations (filled: sky, open: star) | Spatial sky continuum emission | Spatial sky telluric CO2 absorption deviations (filled: H < 10) | |||||||||||||||||||||||
| 0 | 0 |
|
|
|
|
|
|
| IPAIR | NAME | SHIFT | NEWSHIFT | S/N | NAME | SHIFT | NEWSHIFT | S/N |
| 0 | 12720029 | 0.491178 | 0.00000 | 176.363 | 12720030 | 6.96823e-05 | 0.491108 | 169.071 |
| 1 | 12720024 | 0.489636 | 0.00154200 | 173.217 | 12720023 | 0.00000 | 0.491178 | 164.454 |
| 2 | 12720028 | 0.490231 | 0.000946999 | 171.474 | 12720027 | -0.00215701 | 0.493335 | 163.220 |
| 3 | 12720025 | 0.489405 | 0.00177300 | 160.072 | 12720026 | -0.00206255 | 0.493241 | 155.421 |