| Red | Green | Blue | |
| z | 17.64 | ||
| znorm | Inf | ||
| sky | -Inf | -Inf | -Inf |
| S/N | 30.9 | 51.6 | 55.1 |
| S/N(c) | 0.0 | 0.0 | 0.0 |
| SN(E/C) |
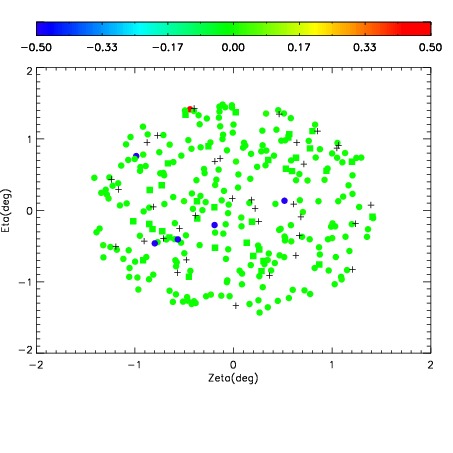
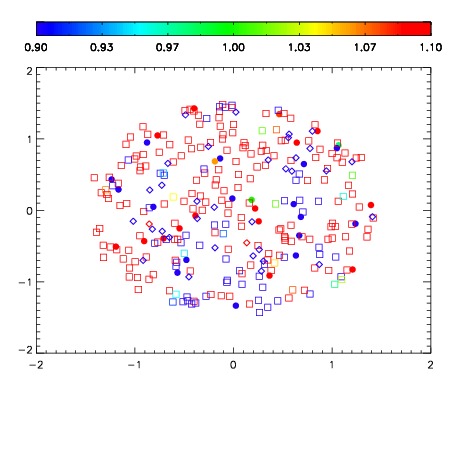
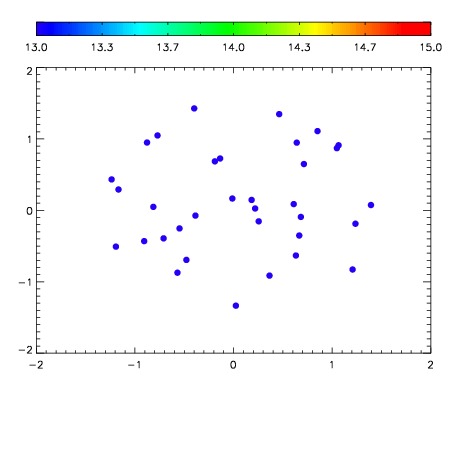

| Frame | Nreads | Zeropoints | Mag plots | Spatial mag deviation | Spatial sky 16325A emission deviations (filled: sky, open: star) | Spatial sky continuum emission | Spatial sky telluric CO2 absorption deviations (filled: H < 10) | |||||||||||||||||||||||
| 0 | 0 |
|
|
|
|
|
|
| IPAIR | NAME | SHIFT | NEWSHIFT | S/N | NAME | SHIFT | NEWSHIFT | S/N |
| 0 | 12580017 | 0.491301 | 0.00000 | 212.744 | 12580018 | -0.00140171 | 0.492703 | 221.914 |
| 1 | 12580012 | 0.489113 | 0.00218800 | 222.154 | 12580011 | 0.00000 | 0.491301 | 223.879 |
| 2 | 12580013 | 0.489372 | 0.00192901 | 221.000 | 12580015 | -0.00175639 | 0.493057 | 222.554 |
| 3 | 12580016 | 0.490924 | 0.000376999 | 208.630 | 12580014 | -0.00232604 | 0.493627 | 221.119 |