| Red | Green | Blue | |
| z | 17.64 | ||
| znorm | Inf | ||
| sky | -Inf | -Inf | -Inf |
| S/N | 29.7 | 50.5 | 53.4 |
| S/N(c) | 0.0 | 0.0 | 0.0 |
| SN(E/C) |
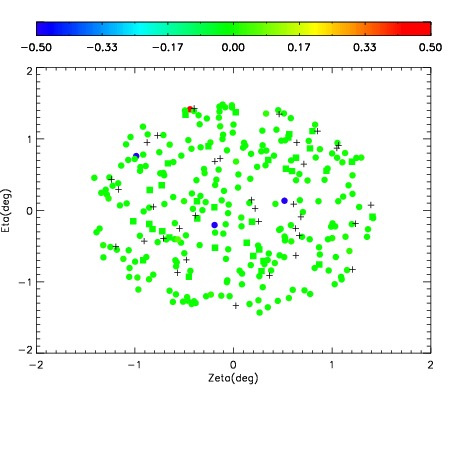
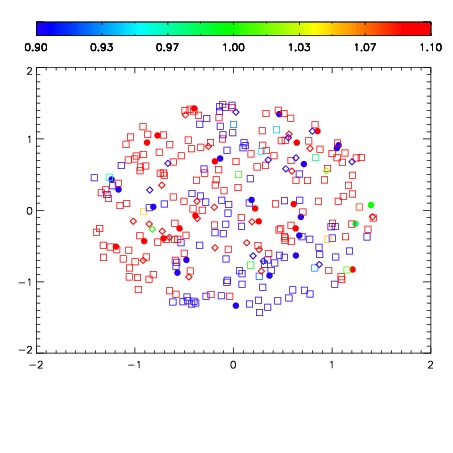
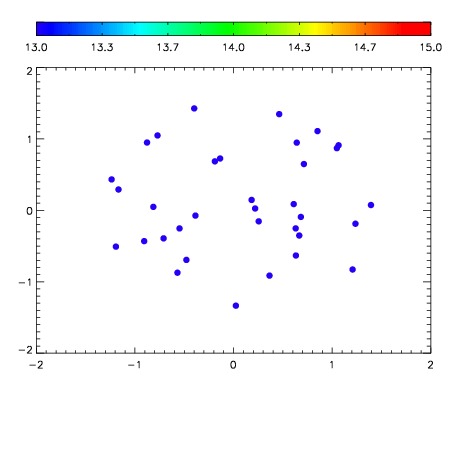

| Frame | Nreads | Zeropoints | Mag plots | Spatial mag deviation | Spatial sky 16325A emission deviations (filled: sky, open: star) | Spatial sky continuum emission | Spatial sky telluric CO2 absorption deviations (filled: H < 10) | |||||||||||||||||||||||
| 0 | 0 |
|
|
|
|
|
|
| IPAIR | NAME | SHIFT | NEWSHIFT | S/N | NAME | SHIFT | NEWSHIFT | S/N |
| 0 | 12660017 | 0.485832 | 0.00000 | 212.803 | 12660015 | -0.000247571 | 0.486080 | 208.862 |
| 1 | 12660012 | 0.483229 | 0.00260299 | 216.969 | 12660011 | 0.00000 | 0.485832 | 218.539 |
| 2 | 12660013 | 0.483464 | 0.00236800 | 216.792 | 12660018 | 0.00153669 | 0.484295 | 215.764 |
| 3 | 12660016 | 0.484499 | 0.00133300 | 211.724 | 12660014 | -0.000814066 | 0.486646 | 208.228 |