| Red | Green | Blue | |
| z | 17.64 | ||
| znorm | Inf | ||
| sky | -Inf | -Inf | -Inf |
| S/N | 24.6 | 44.1 | 46.6 |
| S/N(c) | 0.0 | 0.0 | 0.0 |
| SN(E/C) |
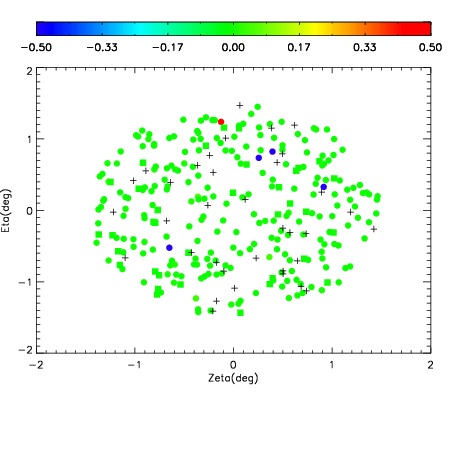
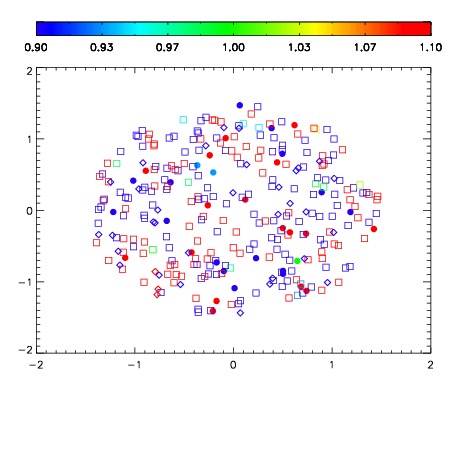
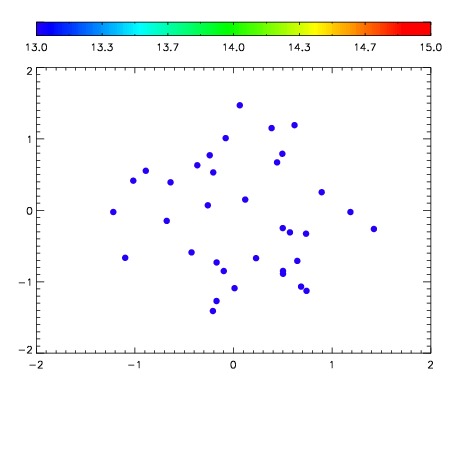

| Frame | Nreads | Zeropoints | Mag plots | Spatial mag deviation | Spatial sky 16325A emission deviations (filled: sky, open: star) | Spatial sky continuum emission | Spatial sky telluric CO2 absorption deviations (filled: H < 10) | |||||||||||||||||||||||
| 0 | 0 |
|
|
|
|
|
|
| IPAIR | NAME | SHIFT | NEWSHIFT | S/N | NAME | SHIFT | NEWSHIFT | S/N |
| 0 | 11940061 | 0.495774 | 0.00000 | 212.506 | 11940063 | -0.00336754 | 0.499142 | 216.665 |
| 1 | 11940065 | 0.495344 | 0.000429988 | 223.247 | 11940066 | -0.00158433 | 0.497358 | 222.599 |
| 2 | 11940064 | 0.495152 | 0.000622004 | 219.695 | 11940062 | -0.00369225 | 0.499466 | 216.954 |
| 3 | 11940060 | 0.495297 | 0.000476986 | 205.830 | 11940059 | 0.00000 | 0.495774 | 205.257 |