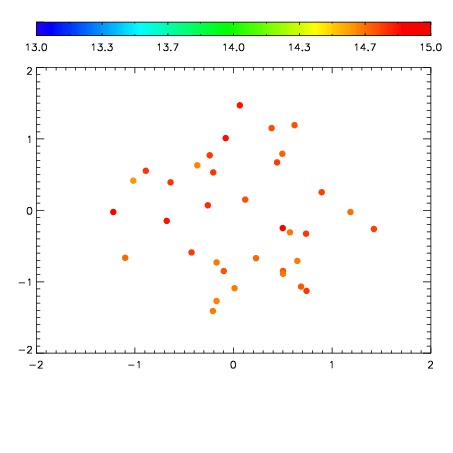
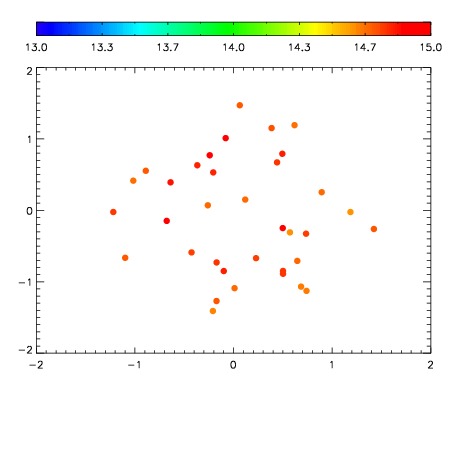
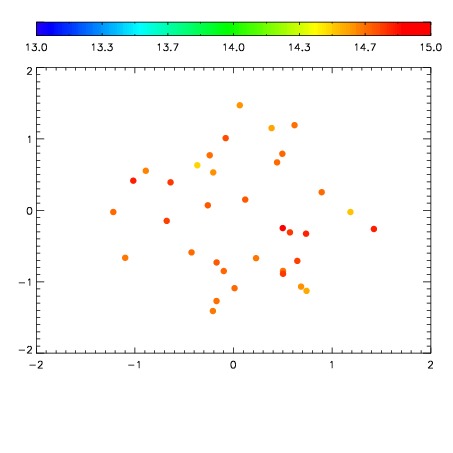
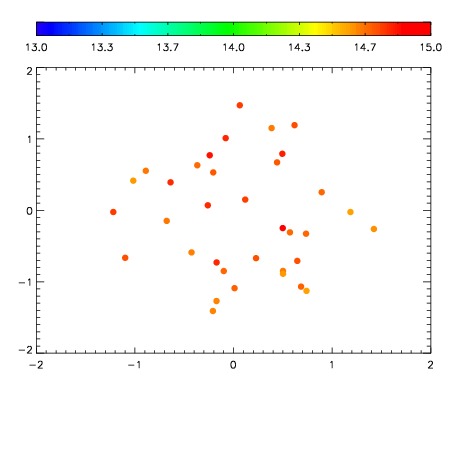
| Frame | Nreads | Zeropoints | Mag plots
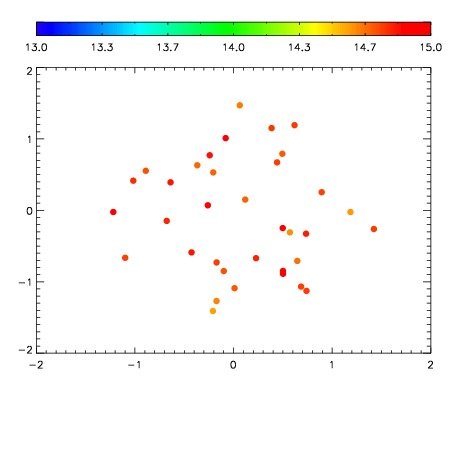
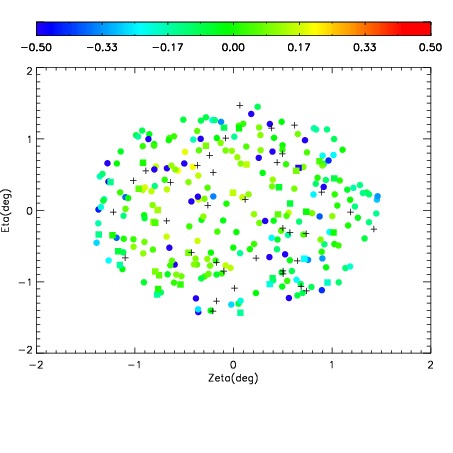
| Spatial mag deviation
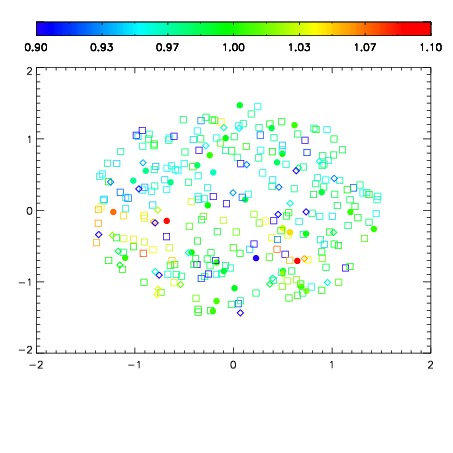
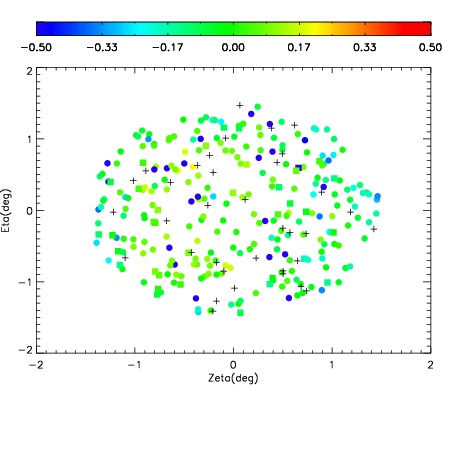
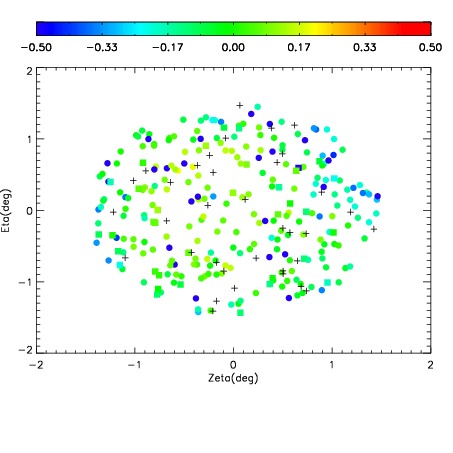
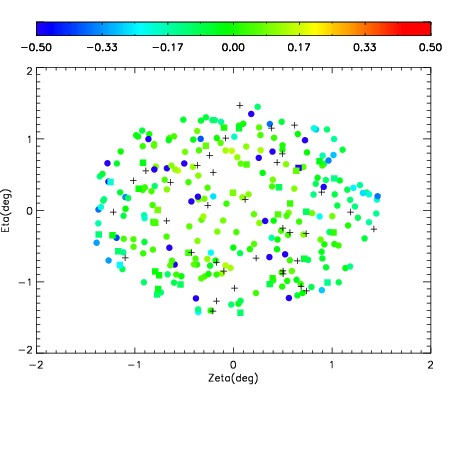
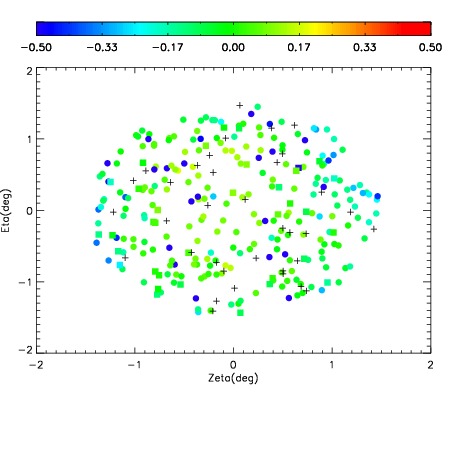
| Spatial sky 16325A emission deviations (filled: sky, open: star)
| Spatial sky continuum emission
| Spatial sky telluric CO2 absorption deviations (filled: H < 10)
|
| 11990035
| 47
| | Red | Green | Blue
| | z | | 18.80
| | znorm | | 14.62
| | sky | 14.8 | 14.8 | 14.6
| | S/N | 10.7 | 18.5 | 20.1
| | S/N(c) | 9.4 | 17.3 | 18.6
| | SN(E/C) 0.40
|
| 
| 
| 
| 
| 
|
| 11990036
| 47
| | Red | Green | Blue
| | z | | 18.77
| | znorm | | 14.59
| | sky | 14.6 | 14.6 | 15.0
| | S/N | 10.3 | 17.9 | 19.4
| | S/N(c) | 9.1 | 16.9 | 17.9
| | SN(E/C) 0.40
|
| 
| 
| 
| 
| 
|
| 11990037
| 47
| | Red | Green | Blue
| | z | | 18.86
| | znorm | | 14.68
| | sky | 14.7 | 14.7 | 14.8
| | S/N | 10.6 | 18.1 | 19.3
| | S/N(c) | 9.1 | 17.0 | 18.3
| | SN(E/C) 0.38
|
| 
| 
| 
| 
| 
|
| 11990038
| 47
| | Red | Green | Blue
| | z | | 18.58
| | znorm | | 14.40
| | sky | 14.9 | 14.7 | 14.8
| | S/N | 8.7 | 15.3 | 16.9
| | S/N(c) | 7.4 | 14.4 | 16.1
| | SN(E/C) 0.40
|
| 
| 
| 
| 
| 
|
| 11990039
| 47
| | Red | Green | Blue
| | z | | 18.44
| | znorm | | 14.26
| | sky | 15.1 | 14.7 | 14.9
| | S/N | 8.3 | 14.3 | 16.1
| | S/N(c) | 7.3 | 13.5 | 15.1
| | SN(E/C) 0.45
|
| 
| 
| 
| 
| 
|
| 11990040
| 47
| | Red | Green | Blue
| | z | | 18.60
| | znorm | | 14.42
| | sky | 14.8 | 14.7 | 14.9
| | S/N | 8.6 | 16.0 | 16.6
| | S/N(c) | 7.5 | 14.8 | 15.5
| | SN(E/C) 0.41
|
| 
| 
| 
| 
| 
|
| 11990041
| 47
| | Red | Green | Blue
| | z | | 18.32
| | znorm | | 14.14
| | sky | 14.7 | 14.7 | 14.9
| | S/N | 7.4 | 14.2 | 14.4
| | S/N(c) | 6.3 | 13.2 | 13.4
| | SN(E/C) 0.45
|
| 
| 
| 
| 
| 
|
| 11990042
| 47
| | Red | Green | Blue
| | z | | 18.49
| | znorm | | 14.31
| | sky | 14.9 | 14.7 | 14.8
| | S/N | 8.5 | 15.6 | 16.3
| | S/N(c) | 7.4 | 14.3 | 15.1
| | SN(E/C) 0.42
|
| 
| 
| 
| 
| 
|