| Red | Green | Blue | |
| z | 17.64 | ||
| znorm | Inf | ||
| sky | -Inf | -Inf | -Inf |
| S/N | 16.5 | 30.7 | 33.4 |
| S/N(c) | 0.0 | 0.0 | 0.0 |
| SN(E/C) |
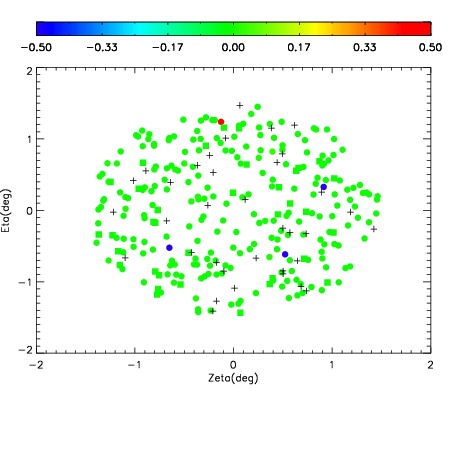
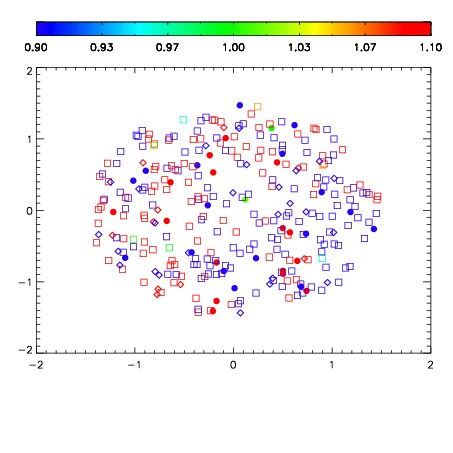
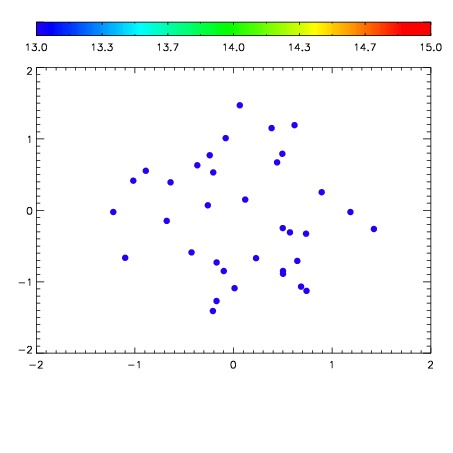

| Frame | Nreads | Zeropoints | Mag plots | Spatial mag deviation | Spatial sky 16325A emission deviations (filled: sky, open: star) | Spatial sky continuum emission | Spatial sky telluric CO2 absorption deviations (filled: H < 10) | |||||||||||||||||||||||
| 0 | 0 |
|
|
|
|
|
|
| IPAIR | NAME | SHIFT | NEWSHIFT | S/N | NAME | SHIFT | NEWSHIFT | S/N |
| 0 | 11990041 | 0.508848 | 0.00000 | 163.422 | 11990039 | 0.00223409 | 0.506614 | 177.464 |
| 1 | 11990037 | 0.505090 | 0.00375801 | 215.145 | 11990035 | 0.00000 | 0.508848 | 206.080 |
| 2 | 11990036 | 0.505253 | 0.00359499 | 202.861 | 11990038 | 0.00225202 | 0.506596 | 188.574 |
| 3 | 11990040 | 0.508524 | 0.000324011 | 188.061 | 11990042 | 0.00129457 | 0.507553 | 178.140 |