| Red | Green | Blue | |
| z | 17.64 | ||
| znorm | Inf | ||
| sky | -Inf | -Inf | -Inf |
| S/N | 22.8 | 40.2 | 41.4 |
| S/N(c) | 0.0 | 0.0 | 0.0 |
| SN(E/C) |
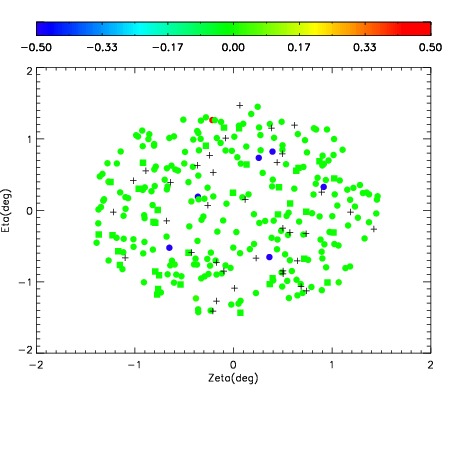
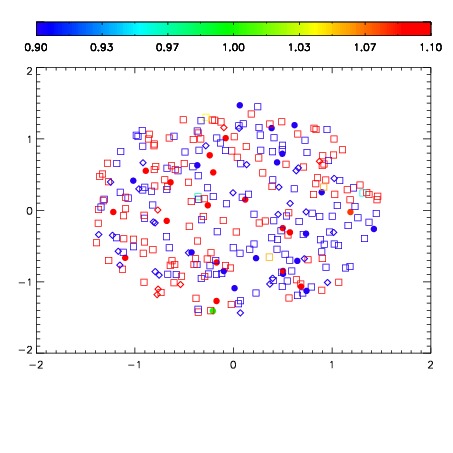
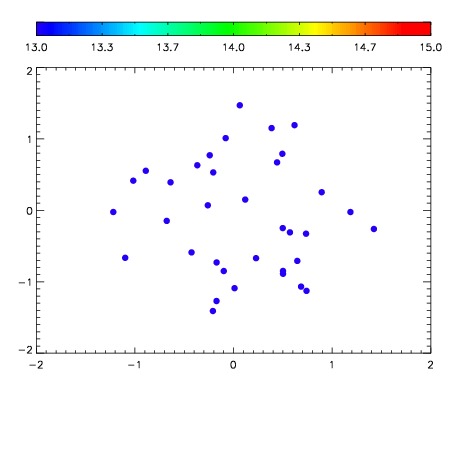

| Frame | Nreads | Zeropoints | Mag plots | Spatial mag deviation | Spatial sky 16325A emission deviations (filled: sky, open: star) | Spatial sky continuum emission | Spatial sky telluric CO2 absorption deviations (filled: H < 10) | |||||||||||||||||||||||
| 0 | 0 |
|
|
|
|
|
|
| IPAIR | NAME | SHIFT | NEWSHIFT | S/N | NAME | SHIFT | NEWSHIFT | S/N |
| 0 | 12200016 | 0.498111 | 0.00000 | 223.596 | 12200018 | -0.00451519 | 0.502626 | 225.714 |
| 1 | 12200012 | 0.496335 | 0.00177601 | 232.687 | 12200014 | -0.00341439 | 0.501525 | 230.191 |
| 2 | 12200013 | 0.496477 | 0.00163400 | 230.600 | 12200015 | -0.00358084 | 0.501692 | 229.998 |
| 3 | 12200017 | 0.497836 | 0.000275016 | 226.845 | 12200011 | 0.00000 | 0.498111 | 227.089 |