| Red | Green | Blue | |
| z | 17.64 | ||
| znorm | Inf | ||
| sky | -Inf | -Inf | -Inf |
| S/N | 22.6 | 40.0 | 45.0 |
| S/N(c) | 0.0 | 0.0 | 0.0 |
| SN(E/C) |
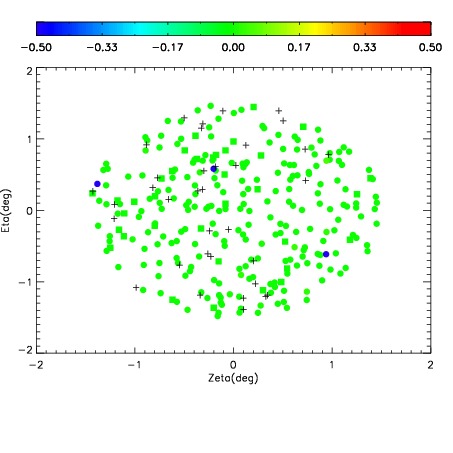
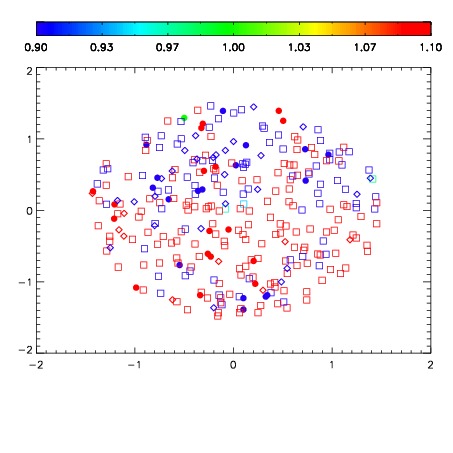
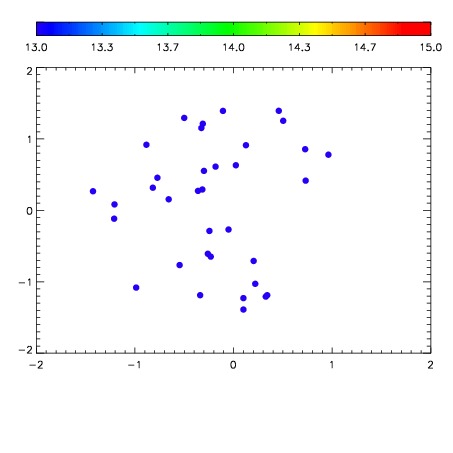

| Frame | Nreads | Zeropoints | Mag plots | Spatial mag deviation | Spatial sky 16325A emission deviations (filled: sky, open: star) | Spatial sky continuum emission | Spatial sky telluric CO2 absorption deviations (filled: H < 10) | |||||||||||||||||||||||
| 0 | 0 |
|
|
|
|
|
|
| IPAIR | NAME | SHIFT | NEWSHIFT | S/N | NAME | SHIFT | NEWSHIFT | S/N |
| 0 | 11440062 | 0.481472 | 0.00000 | 198.760 | 11440064 | -0.000556126 | 0.482028 | 223.561 |
| 1 | 11440058 | 0.480118 | 0.00135398 | 238.413 | 11440060 | 0.000410432 | 0.481062 | 242.430 |
| 2 | 11440063 | 0.481180 | 0.000291973 | 223.062 | 11440057 | 0.00000 | 0.481472 | 238.806 |
| 3 | 11440059 | 0.481125 | 0.000346988 | 213.065 | 11440061 | 0.000877992 | 0.480594 | 234.789 |