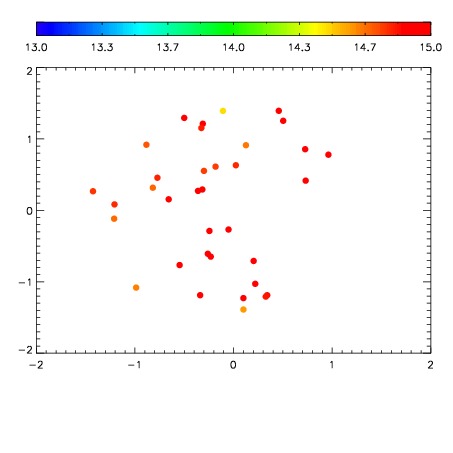
| Frame | Nreads | Zeropoints | Mag plots
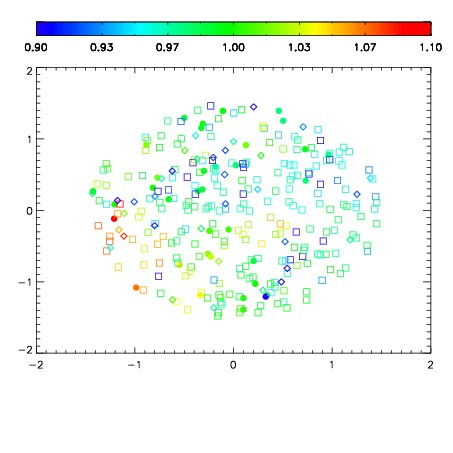
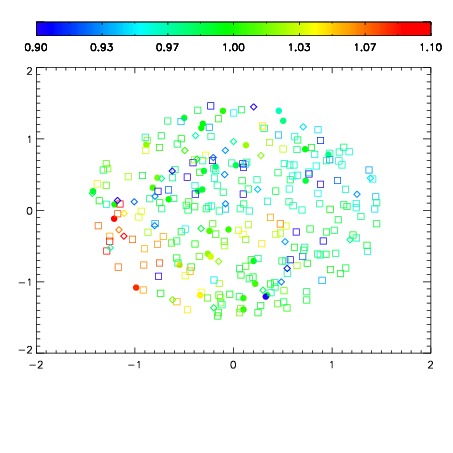
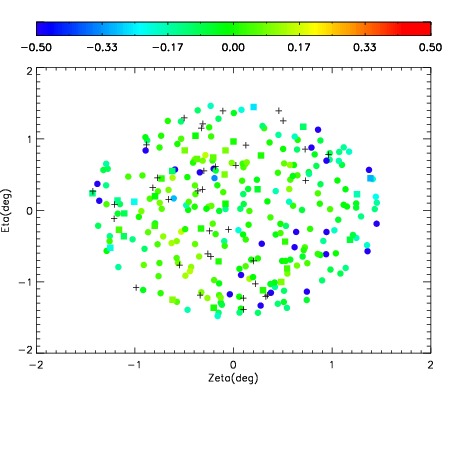
| Spatial mag deviation
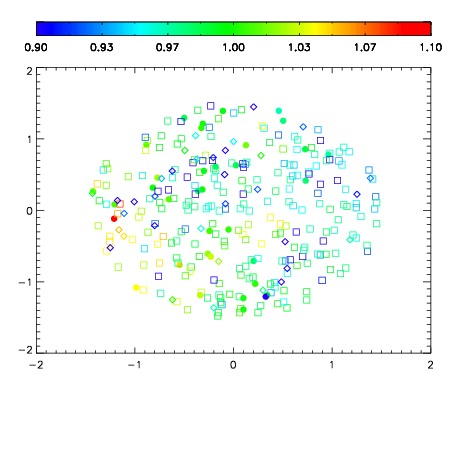
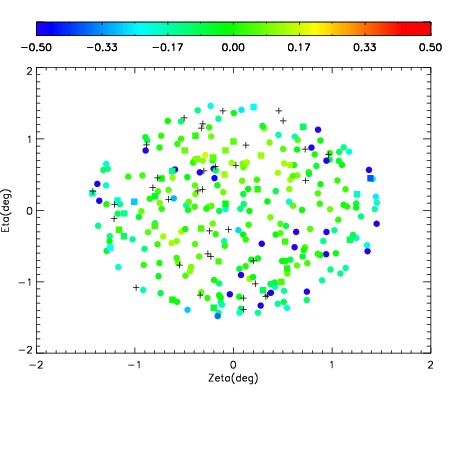
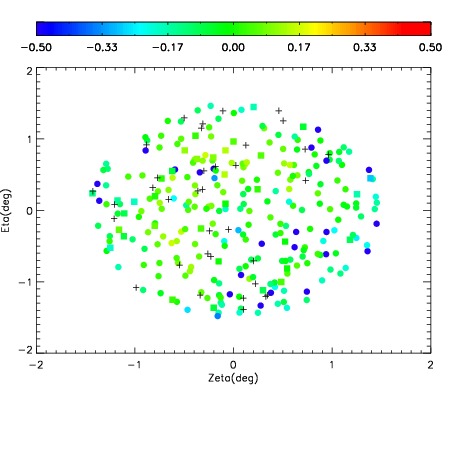
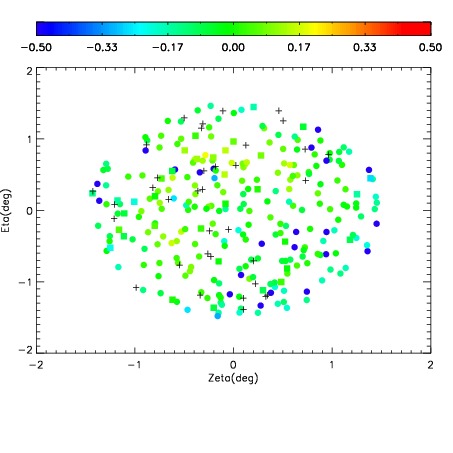
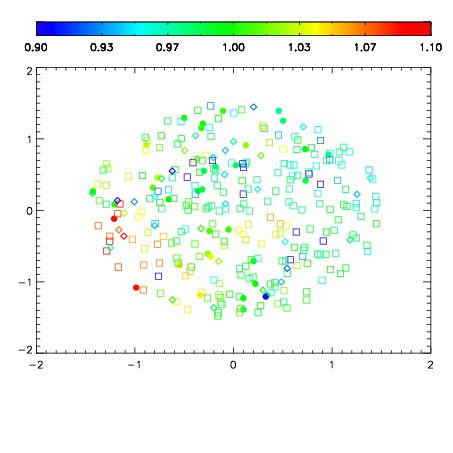
| Spatial sky 16325A emission deviations (filled: sky, open: star)
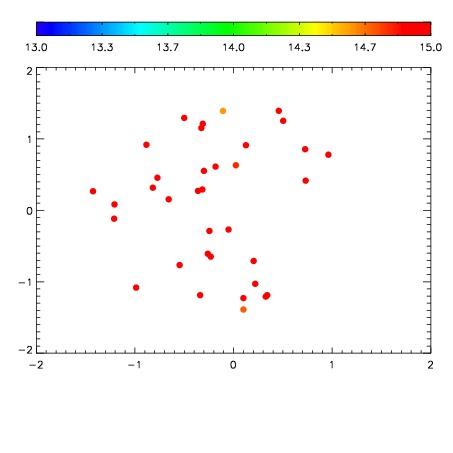
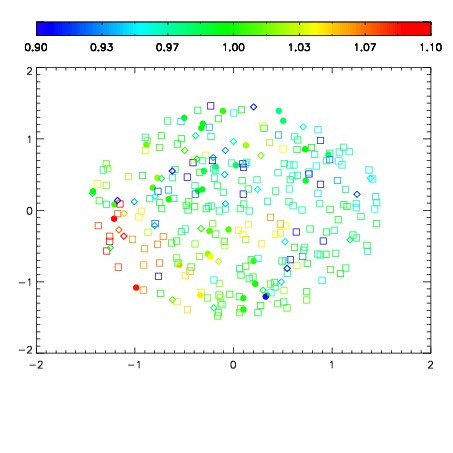
| Spatial sky continuum emission
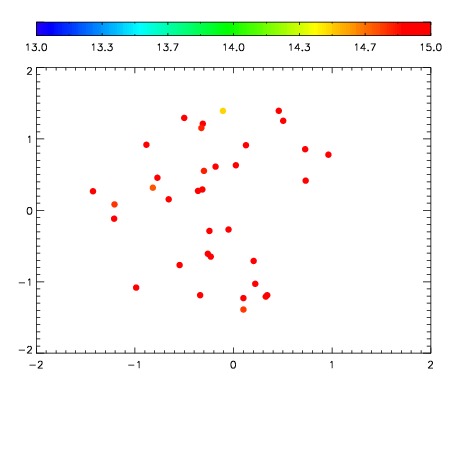
| Spatial sky telluric CO2 absorption deviations (filled: H < 10)
|
| 11720066
| 47
| | Red | Green | Blue
| | z | | 18.91
| | znorm | | 14.73
| | sky | 15.7 | 14.9 | 14.7
| | S/N | 13.9 | 22.8 | 25.0
| | S/N(c) | 12.2 | 21.7 | 23.8
| | SN(E/C) 0.36
|
| 
| 
| 
| 
| 
|
| 11720067
| 47
| | Red | Green | Blue
| | z | | 18.96
| | znorm | | 14.78
| | sky | 15.2 | 14.9 | 15.1
| | S/N | 14.1 | 23.6 | 26.0
| | S/N(c) | 12.5 | 22.6 | 24.7
| | SN(E/C) 0.35
|
| 
| 
| 
| 
| 
|
| 11720068
| 47
| | Red | Green | Blue
| | z | | 18.83
| | znorm | | 14.65
| | sky | 15.2 | 14.9 | 15.3
| | S/N | 13.0 | 21.7 | 24.2
| | S/N(c) | 11.5 | 20.8 | 22.6
| | SN(E/C) 0.39
|
| 
| 
| 
| 
| 
|
| 11720069
| 47
| | Red | Green | Blue
| | z | | 18.81
| | znorm | | 14.63
| | sky | 15.2 | 15.0 | 15.2
| | S/N | 12.7 | 21.5 | 23.7
| | S/N(c) | 11.2 | 20.4 | 22.4
| | SN(E/C) 0.37
|
| 
| 
| 
| 
| 
|
| 11720070
| 47
| | Red | Green | Blue
| | z | | 18.71
| | znorm | | 14.53
| | sky | 15.1 | 14.8 | 15.2
| | S/N | 11.6 | 20.2 | 22.2
| | S/N(c) | 10.3 | 19.3 | 21.2
| | SN(E/C) 0.40
|
| 
| 
| 
| 
| 
|
| 11720071
| 47
| | Red | Green | Blue
| | z | | 18.54
| | znorm | | 14.36
| | sky | 15.4 | 14.9 | 15.2
| | S/N | 10.8 | 18.9 | 20.5
| | S/N(c) | 9.4 | 17.5 | 19.1
| | SN(E/C) 0.39
|
| 
| 
| 
| 
| 
|
| 11720072
| 47
| | Red | Green | Blue
| | z | | 18.48
| | znorm | | 14.30
| | sky | 15.3 | 15.0 | 15.2
| | S/N | 10.2 | 17.8 | 20.2
| | S/N(c) | 9.0 | 16.7 | 18.9
| | SN(E/C) 0.43
|
| 
| 
| 
| 
| 
|
| 11720073
| 47
| | Red | Green | Blue
| | z | | 18.65
| | znorm | | 14.47
| | sky | 15.1 | 14.9 | 15.4
| | S/N | 11.4 | 19.5 | 21.8
| | S/N(c) | 10.1 | 18.4 | 20.3
| | SN(E/C) 0.39
|
| 
| 
| 
| 
| 
|