| Red | Green | Blue | |
| z | 17.64 | ||
| znorm | Inf | ||
| sky | -Inf | -Inf | -Inf |
| S/N | 21.8 | 39.7 | 43.3 |
| S/N(c) | 0.0 | 0.0 | 0.0 |
| SN(E/C) |
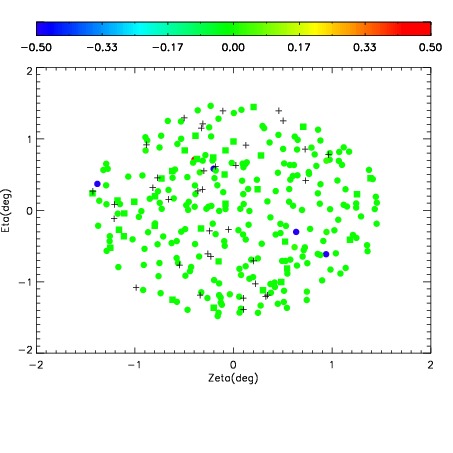
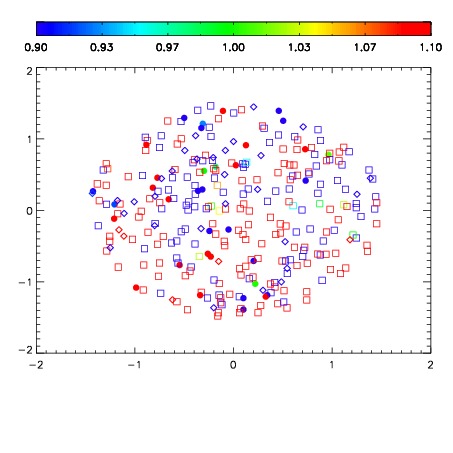
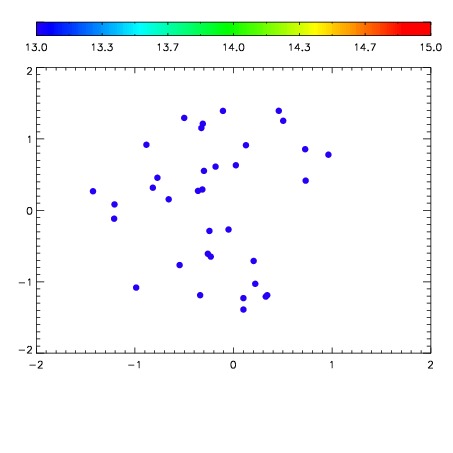

| Frame | Nreads | Zeropoints | Mag plots | Spatial mag deviation | Spatial sky 16325A emission deviations (filled: sky, open: star) | Spatial sky continuum emission | Spatial sky telluric CO2 absorption deviations (filled: H < 10) | |||||||||||||||||||||||
| 0 | 0 |
|
|
|
|
|
|
| IPAIR | NAME | SHIFT | NEWSHIFT | S/N | NAME | SHIFT | NEWSHIFT | S/N |
| 0 | 11720068 | 0.490355 | 0.00000 | 203.438 | 11720069 | -0.00254466 | 0.492900 | 203.628 |
| 1 | 11720067 | 0.488899 | 0.00145602 | 218.249 | 11720066 | 0.00000 | 0.490355 | 216.410 |
| 2 | 11720071 | 0.488726 | 0.00162902 | 178.855 | 11720070 | -0.00275802 | 0.493113 | 189.093 |
| 3 | 11720072 | 0.489338 | 0.00101700 | 167.571 | 11720073 | -0.00307791 | 0.493433 | 188.866 |