| Red | Green | Blue | |
| z | 17.64 | ||
| znorm | Inf | ||
| sky | -Inf | -NaN | -Inf |
| S/N | 27.6 | 47.1 | 51.7 |
| S/N(c) | 0.0 | 0.0 | 0.0 |
| SN(E/C) |

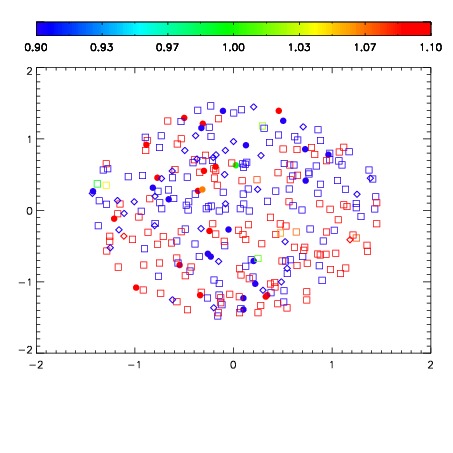
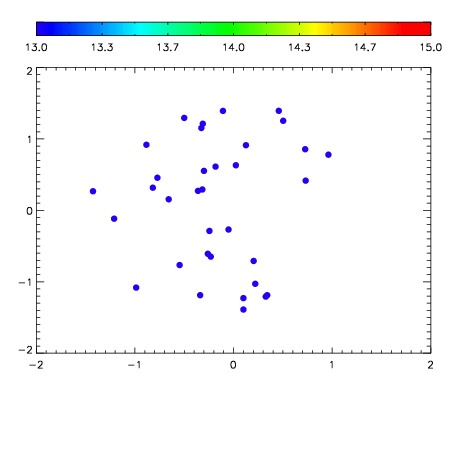

| Frame | Nreads | Zeropoints | Mag plots | Spatial mag deviation | Spatial sky 16325A emission deviations (filled: sky, open: star) | Spatial sky continuum emission | Spatial sky telluric CO2 absorption deviations (filled: H < 10) | |||||||||||||||||||||||
| 0 | 0 |
|
|
|
|
|
|
| IPAIR | NAME | SHIFT | NEWSHIFT | S/N | NAME | SHIFT | NEWSHIFT | S/N |
| 0 | 11940049 | 0.496729 | 0.00000 | 234.612 | 11940048 | 0.00000 | 0.496729 | 232.568 |
| 1 | 11940053 | 0.494795 | 0.00193399 | 236.173 | 11940051 | 4.84567e-06 | 0.496724 | 234.142 |
| 2 | 11940054 | 0.495291 | 0.00143799 | 234.044 | 11940052 | 0.000204203 | 0.496525 | 230.749 |
| 3 | 11940050 | 0.496607 | 0.000121981 | 232.289 | 11940055 | -9.59199e-05 | 0.496825 | 221.701 |